
File:ADV fft length.png
Original file (800 × 800 pixels, file size: 166 KB, MIME type: image/png)
Summary
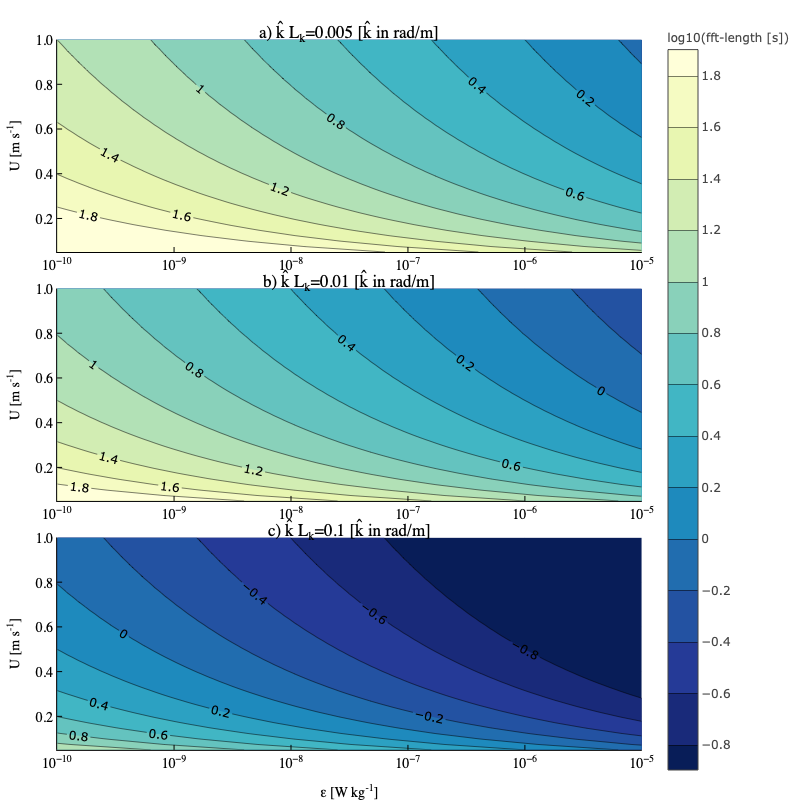
Contours represent the log of the fft-length required to resolve the non-dimensional wavenumber [rad/m] indicated in each panel's title. The contours are plotted as a function of [math]\displaystyle{ \varepsilon }[/math] and speed past the sensor u. The fft-length controls the lowest frequency that is resolved by the spectra. Panel (a) provides a bit of breathing room for fitting the inertial subrange given the sparse number of spectral observations at low wavenumber. The middle panel (b) shows the fft-length to resolve 1 decade's worth of inertial subrange. The bottom panel (c) shows the fft-length that begins to resolve the viscous subrange i.e., the end of the inertial subrange. It can be used to gauge the fft-length for computing shear probe spectra to estimate [math]\displaystyle{ \varepsilon }[/math] from the viscous subrange.
File history
Click on a date/time to view the file as it appeared at that time.
| Date/Time | Thumbnail | Dimensions | User | Comment | |
|---|---|---|---|---|---|
| current | 20:59, 10 July 2022 | | 800 × 800 (166 KB) | CynthiaBluteau (talk | contribs) | Contours represent the log of the fft-length required to resolve the non-dimensional wavenumber [rad/m] indicated in each panel's title. The contours are plotted as a function of <math>\varepsilon</math> and speed past the sensor u. The fft-length controls the lowest frequency that is resolved by the spectra. The bottom panel (c) shows the fft-length that begins to resolve the viscous subrange i.e., the end of the inertial subrange. The middle panel shows the fft-length to resolve 1 decade'... |
You cannot overwrite this file.
File usage
The following page uses this file: