
File:SegmentAnisotropyLowE.png
Size of this preview: 600 × 600 pixels. Other resolution: 1,200 × 1,200 pixels.
Original file (1,200 × 1,200 pixels, file size: 207 KB, MIME type: image/png)
Summary
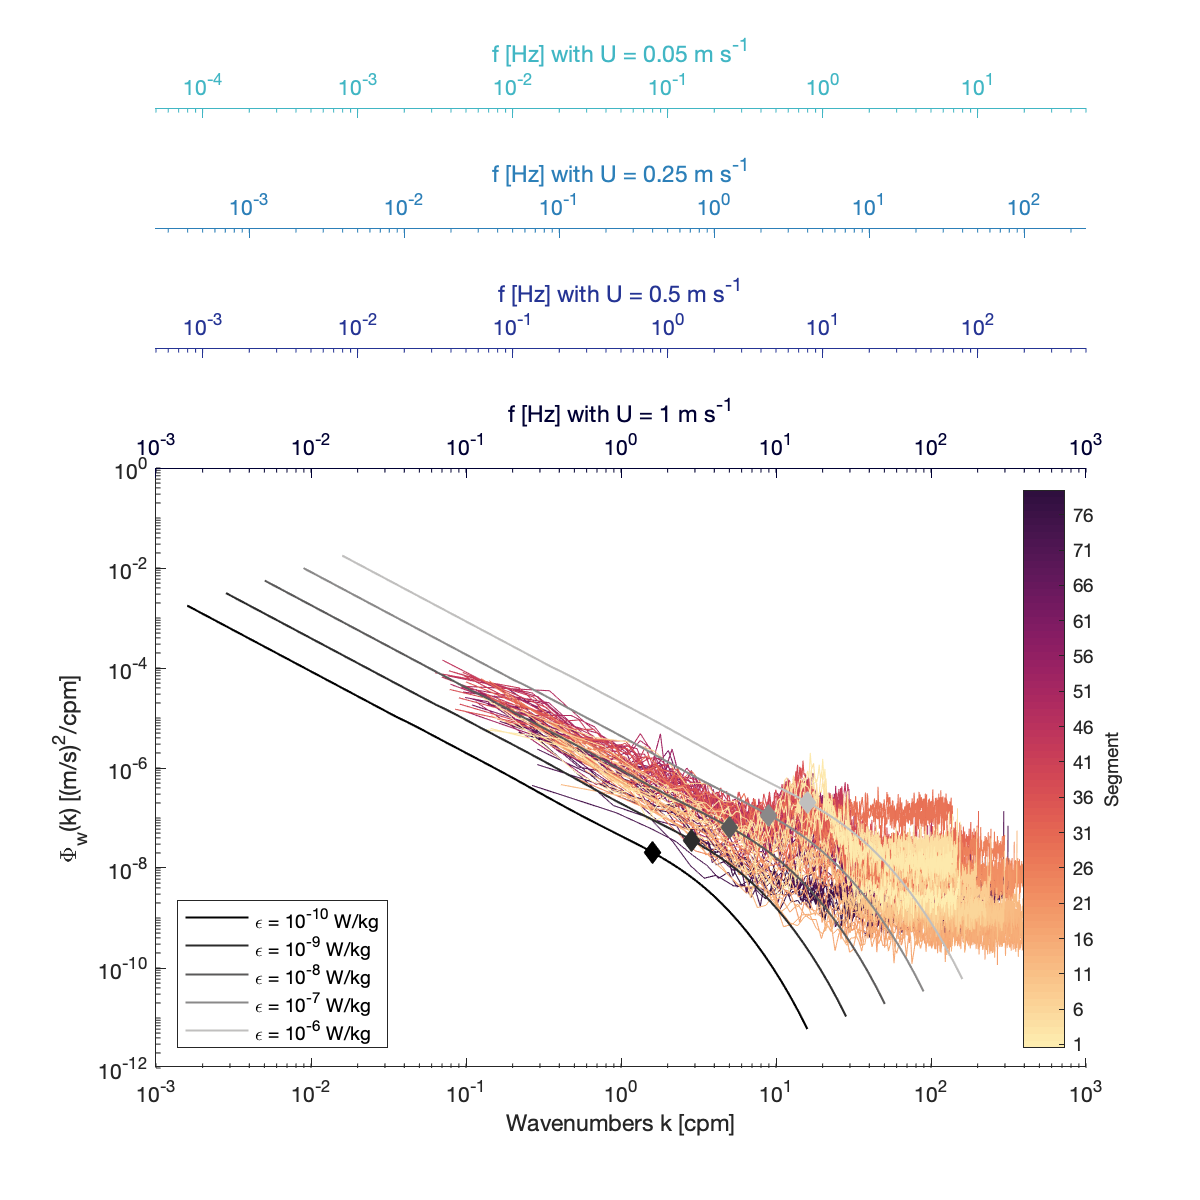
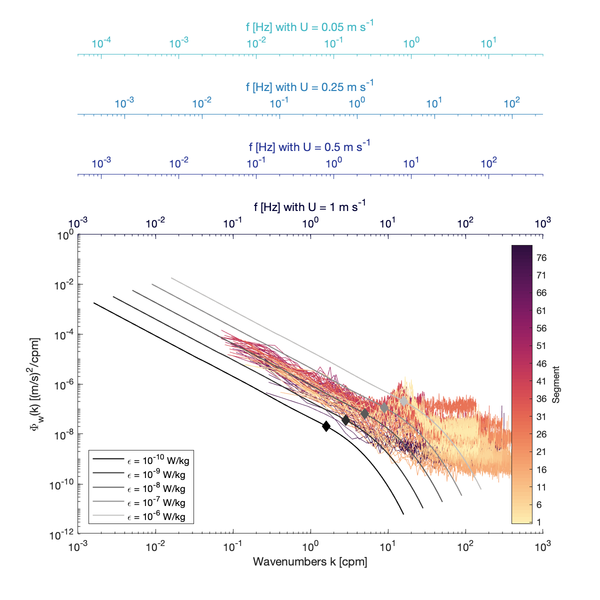
Example spectra for the Under-ice MAVS dataset. About 17h worth of segments are shown, and each spectrum was constructed from 1024 s (17.06 min) worth of data, which was split into FFT-length of 512s (4096 samples). The speeds past the sensor are of the order of a few cm/s. The combination of low [math]\displaystyle{ \varepsilon }[/math] and low speeds requires using relatively long segments to compute the spectra. The spectra are also impacted by vibrations and vortex shedding that are contaminating the measurements around 10cpm.
File history
Click on a date/time to view the file as it appeared at that time.
| Date/Time | Thumbnail | Dimensions | User | Comment | |
|---|---|---|---|---|---|
| current | 17:41, 5 July 2022 | | 1,200 × 1,200 (207 KB) | CynthiaBluteau (talk | contribs) | Example spectra for the Under-ice MAVS dataset. About 17h worth of segments are shown, and each spectrum was constructed from 1024 s (17.06 min) worth of data, which was split into FFT-length of 512s (4096 samples). The speeds past the sensor are of the order of a few cm/s. The combination of low <math>\varepsilon</math> and low speeds requires using relatively long segments to compute the spectra. The spectra are also impacted by vibrations and vortex shedding that are contaminating the meas... |
You cannot overwrite this file.
File usage
The following page uses this file: