File:Long timeseries.png
From Atomix

Size of this preview: 800 × 500 pixels. Other resolution: 1,200 × 750 pixels.
Original file (1,200 × 750 pixels, file size: 89 KB, MIME type: image/png)
Summary
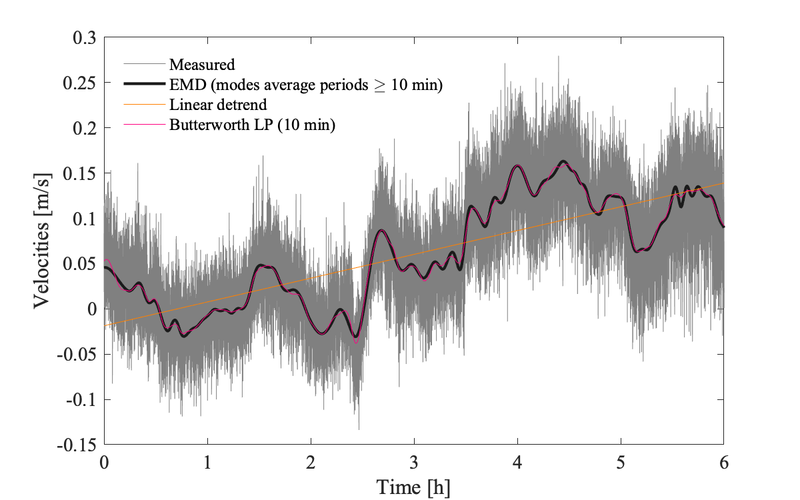
Example of velocities subsampled at 4Hz. Original timeseries measured at 64Hz, but lower sampling rate would be sufficient for IDM analysis. The different lines represent the results of various detrending.
File history
Click on a date/time to view the file as it appeared at that time.
| Date/Time | Thumbnail | Dimensions | User | Comment | |
|---|---|---|---|---|---|
| current | 17:22, 29 November 2021 | | 1,200 × 750 (89 KB) | CynthiaBluteau (talk | contribs) | Example of velocities subsampled at 4Hz. Original timeseries measured at 64Hz, but lower sampling rate would be sufficient for IDM analysis. The different lines represent the results of various detrending. |
You cannot overwrite this file.
File usage
The following page uses this file:

