File:Velocity spectra fft segment.png
From Atomix

Size of this preview: 800 × 450 pixels. Other resolution: 1,200 × 675 pixels.
Original file (1,200 × 675 pixels, file size: 91 KB, MIME type: image/png)
Summary
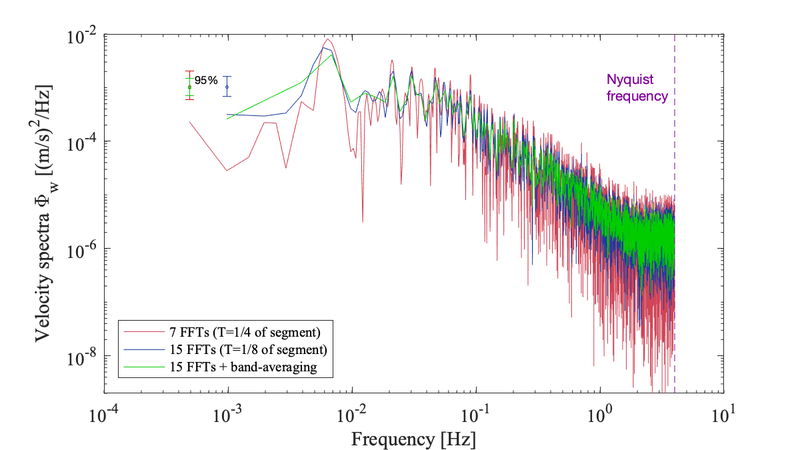
Accompanies  to illustrate the impact of increased FFT in the "smoothness" of the spectra and loss of spectral information at the lowest frequencies. Error bars also reduce with the increasing number of FFTs. The green line has been further band-averaged in the frequency domain, which retains the lower frequency data albeit with a reduced frequency resolution (1/3 of 15 FFTs example given 3 frequency bands were averaged).
File history
Click on a date/time to view the file as it appeared at that time.
| Date/Time | Thumbnail | Dimensions | User | Comment | |
|---|---|---|---|---|---|
| current | 16:02, 7 December 2021 | | 1,200 × 675 (91 KB) | CynthiaBluteau (talk | contribs) | Accompanies File:Velocitie_fft_segment.png to illustrate the impact of increased FFT in the "smoothness" of the spectra and loss of spectral information at the lowest frequencies. Error bars also reduce with the increasing number of FFTs. The green... |
You cannot overwrite this file.
File usage
There are no pages that use this file.

