Velocity despiking: Difference between revisions
| Line 27: | Line 27: | ||
In the 1970s, scientists developed methods based on nonlinear median filters | In the 1970s, scientists developed methods based on nonlinear median filters | ||
<ref>{{Cite journal|authors=A.E. Beaton, J.W. Tukey|journal_or_publisher= Technometrics|paper_or_booktitle= The fitting of power series, meaning polynomials, illustrated on band-spectroscopic data | <ref>{{Cite journal|authors=A.E. Beaton, J.W. Tukey|journal_or_publisher= Technometrics|paper_or_booktitle= The fitting of power series, meaning polynomials, illustrated on band-spectroscopic data | ||
|year= 1974|doi=10.1080/00401706.1974.10489171}}</ref>. | |year= 1974|doi=10.1080/00401706.1974.10489171}}</ref>. These filters are less biased by spikes than other linear operations such as low-pass butterworth filters<ref name="Starkenburg"/>. The moving median filter, for example, only requires a window size, i.e, the number of points over which to calculate the median. This size must be longer than the duration of spikes, which can span consecutive samples. This number must also be sufficiently short to compute a reasonable local median (see Table 1 of Starkenburg et al 2016<ref name="Starkenburg"/>). The challenge then becomes determining the threshold for identifying spikes. | ||
===Identifying the threshold=== | ===Identifying the threshold=== | ||
Revision as of 23:40, 24 November 2021
{{#default_form:Processing}}
{{#arraymap:
Velocity point-measurements
|,|x||}}
{{#arraymap:level 1 raw|,|x||}}
Overview
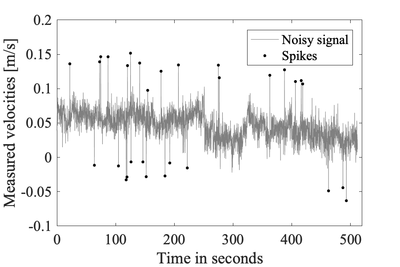
Any measured signal may be contaminated by spikes. These spikes are typically short-lived and transient, which result in sudden change in the measured velocities.
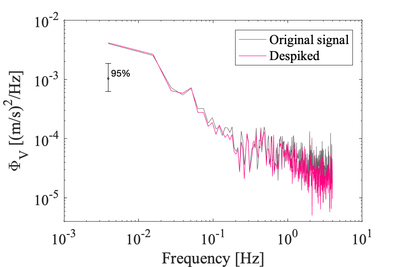
Spikes in velocities measured by acoustic-Doppler velocimeters can result from aliasing of the Doppler signal, in particular when pulses become contaminated by reflecting from complex objects and boundaries [1]. These spikes must be removed because they can alter quite dramatically the velocity spectra, which is then used for fitting inertial subrange model.
-

Example velocities measured by an acoustic-Doppler velocimeters -

Example velocity spectra before and after removing spikes. The variance of the despiked signal has reduced by 12% even though there were 30 spikes
Despiking methods
Several techniques exist for despiking. The most used with acoustic-Doppler velocimeters are the phase-space thresholding techniques [1]. Other techniques currently being investigated by the subgroup are those used in atmospheric turbulence studies [2], in particular the median filter despiking technique [3]. This method derives its threshold for identifying spurious spikes from the dataset.
Filter based methods
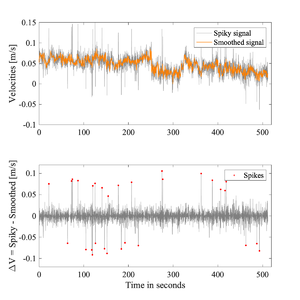
This category of methods is quite common in the literature and have been reviewed extensively by others [1][2]. These methods compare the original signal against a smoothed version, and values exceeding a threshold <math>T</math>are deemed to be spikes. Most commonly, the threshold is applied to the timeseries of velocity differences obtained by subtracting the smoothed velocities from the original spiky signal.

Filter choice
In the 1970s, scientists developed methods based on nonlinear median filters [4]. These filters are less biased by spikes than other linear operations such as low-pass butterworth filters[2]. The moving median filter, for example, only requires a window size, i.e, the number of points over which to calculate the median. This size must be longer than the duration of spikes, which can span consecutive samples. This number must also be sufficiently short to compute a reasonable local median (see Table 1 of Starkenburg et al 2016[2]). The challenge then becomes determining the threshold for identifying spikes.
Identifying the threshold
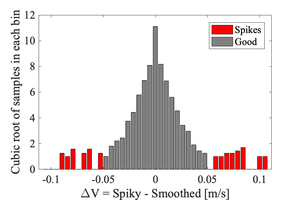
Brock (1986)[3] proposed a way to determine the threshold using a histrogram of the velocity differences.

Phase-space thresholding methods
Elaborate a bit? Or include information in a separate page
Notes
- ↑ 1.0 1.1 1.2 {{#arraymap:D. G. Goring and V.I. Nikora|,|x|x|, |and}}. 2002. Despiking Acoustic Doppler Velocimeter Data. Journal of Hydraulic Engineering. doi:10.1061/ASCE0733-94292002128:1117
- ↑ 2.0 2.1 2.2 2.3 {{#arraymap:D. Starkenburg, S. Metzger, G.J. Fochesatto, J.G Alfieri, R. Gens, A. Prakash and J. Cristobal|,|x|x|, |and}}. 2016. Assessment of Despiking Methods for Turbulence Data in Micrometeorology. J. Atmos. Oceanic Technoly. doi:10.1175/JTECH-D-15-0154.1
- ↑ 3.0 3.1 {{#arraymap:F.V. Brock|,|x|x|, |and}}. 1986. A nonlinear filter to remove impulse noise from meteorological data. J. Atmos. Oceanic Technoly. doi:10.1175/1520-0426(1986)003,0051:ANFTRI.2.0.CO;2
- ↑ {{#arraymap:A.E. Beaton, J.W. Tukey|,|x|x|, |and}}. 1974. The fitting of power series, meaning polynomials, illustrated on band-spectroscopic data. Technometrics. doi:10.1080/00401706.1974.10489171
