File:Threshold logic Brock1986.png: Difference between revisions
From Atomix
Conceptual figure showing how the threshold for identifying spikes is set by Brock 1986 (JTECH). It involves a histogram of the velocity differences |
CynthiaBluteau uploaded a new version of File:Threshold logic Brock1986.png |
(No difference)
| |
Latest revision as of 00:31, 25 November 2021
Summary
Conceptual figure showing how the threshold for identifying spikes is set by Brock 1986 (JTECH). It involves a histogram of the velocity differences
File history
Click on a date/time to view the file as it appeared at that time.
| Date/Time | Thumbnail | Dimensions | User | Comment | |
|---|---|---|---|---|---|
| current | 00:31, 25 November 2021 | 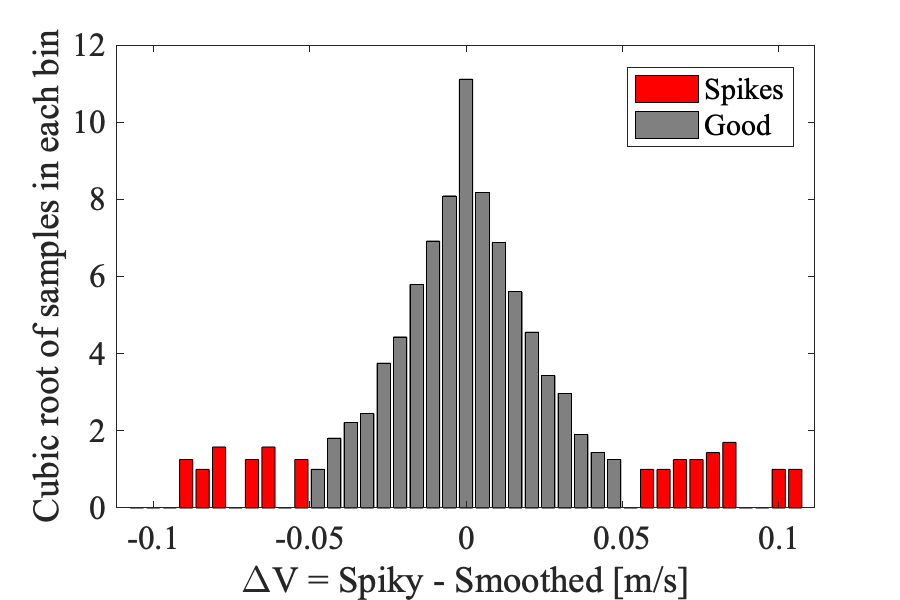 | 900 × 600 (37 KB) | CynthiaBluteau (talk | contribs) | Fixed the threshold so that the local minimum is used for identifying thresholds, as opposed to the local minimum that reaches zero (ideal!) |
| 21:21, 24 November 2021 | 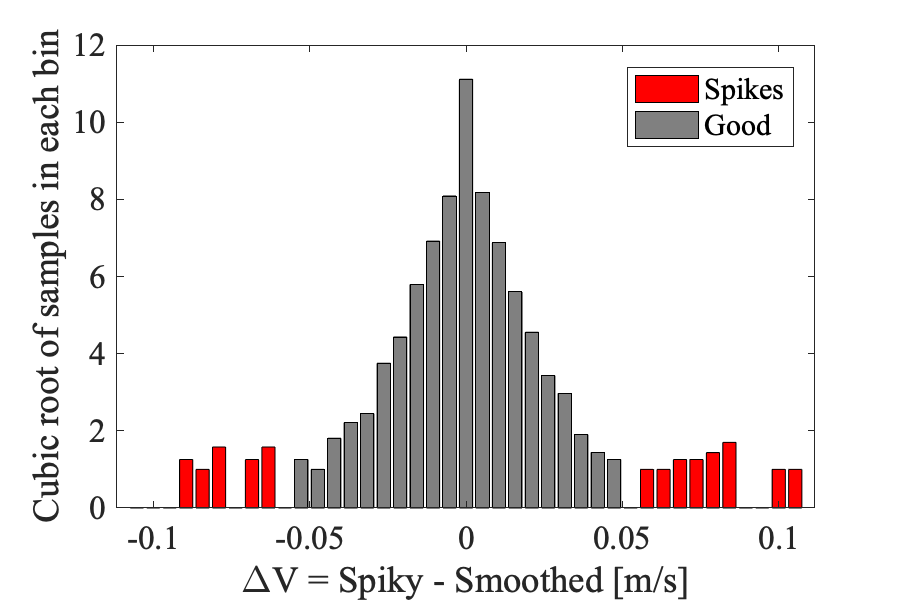 | 900 × 600 (37 KB) | CynthiaBluteau (talk | contribs) | Conceptual figure showing how the threshold for identifying spikes is set by Brock 1986 (JTECH). It involves a histogram of the velocity differences |
You cannot overwrite this file.
File usage
The following page uses this file:

