File:Velocity timescales.png
From Atomix
Size of this preview: 800 × 450 pixels. Other resolution: 1,200 × 675 pixels.
Original file (1,200 × 675 pixels, file size: 66 KB, MIME type: image/png)
Summary
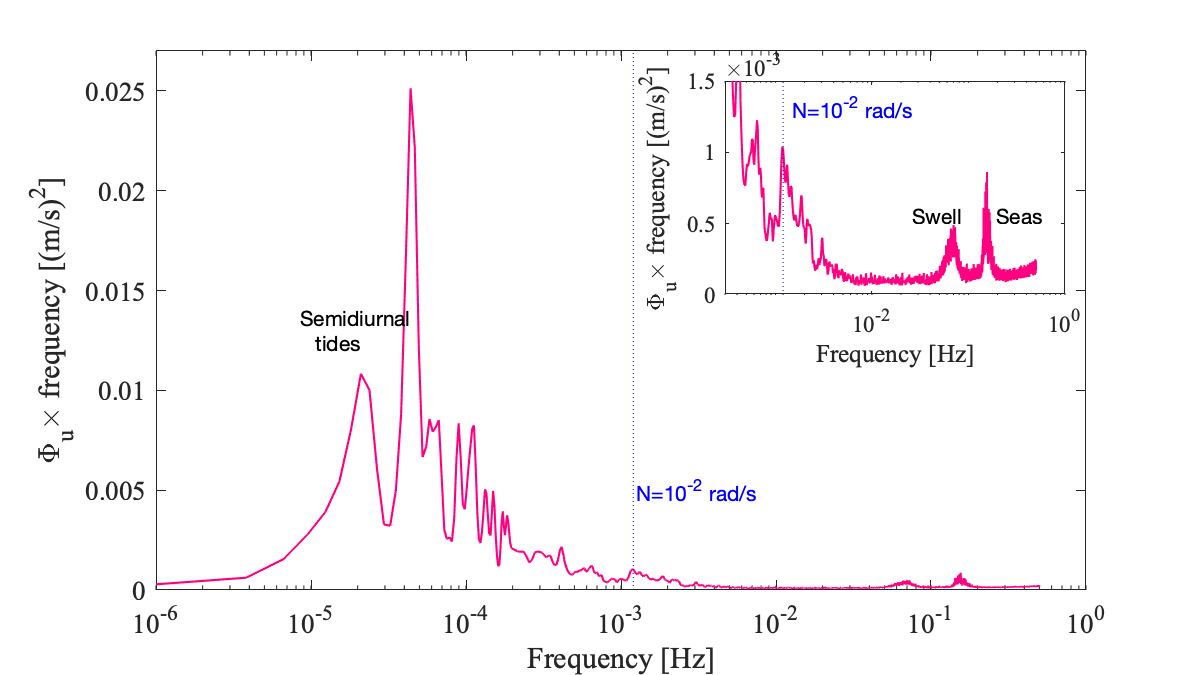
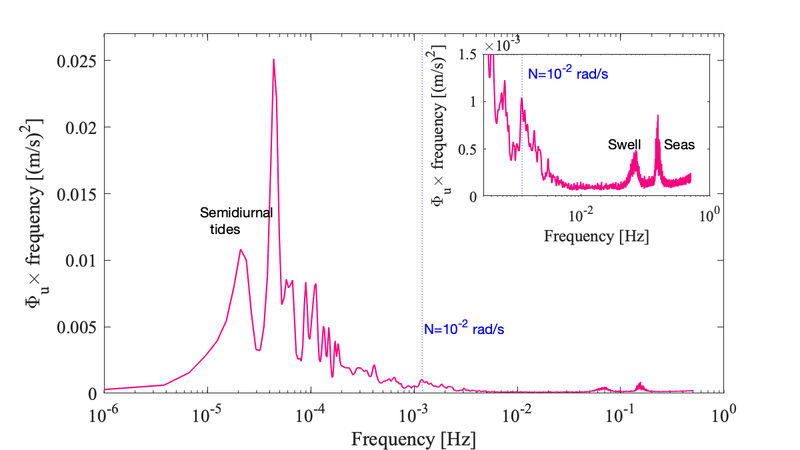
Example velocity observations from an instrument impacted by tides and surface waves, which are presented as variance preserving spectra. The goal is to highlight when turbulence subranges begin in the grand scheme of physical processes that impact velocity observations.
File history
Click on a date/time to view the file as it appeared at that time.
| Date/Time | Thumbnail | Dimensions | User | Comment | |
|---|---|---|---|---|---|
| current | 18:40, 1 December 2021 | | 1,200 × 675 (66 KB) | CynthiaBluteau (talk | contribs) | Example velocity observations from an instrument impacted by tides and surface waves, which are presented as variance preserving spectra. The goal is to highlight when turbulence subranges begin in the grand scheme of physical processes that impact vel... |
You cannot overwrite this file.
File usage
The following page uses this file:

