File list
From Atomix
This special page shows all uploaded files.
| Date | Name | Thumbnail | Size | User | Description | Versions |
|---|---|---|---|---|---|---|
| 20:12, 17 December 2021 | CBluteau.jpg (file) |  |
234 KB | CynthiaBluteau (talk | contribs) | Profile picture. | 1 |
| 14:26, 10 December 2021 | Yueng.jpg (file) |  |
6.52 MB | Yuengdjern (talk | contribs) | 2 | |
| 16:02, 7 December 2021 | Velocity spectra fft segment.png (file) |  |
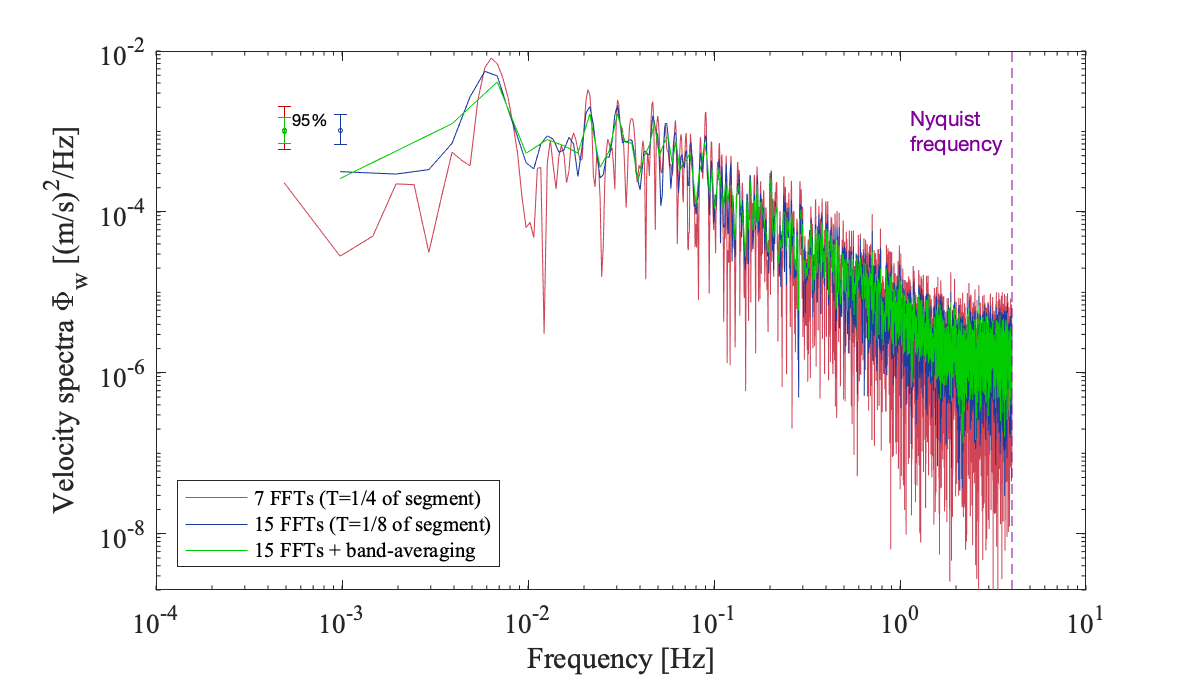
91 KB | CynthiaBluteau (talk | contribs) | Accompanies File:Velocitie_fft_segment.png to illustrate the impact of increased FFT in the "smoothness" of the spectra and loss of spectral information at the lowest frequencies. Error bars also reduce with the increasing number of FFTs. The green... | 1 |
| 15:58, 7 December 2021 | Velocitie fft segment.png (file) |  |
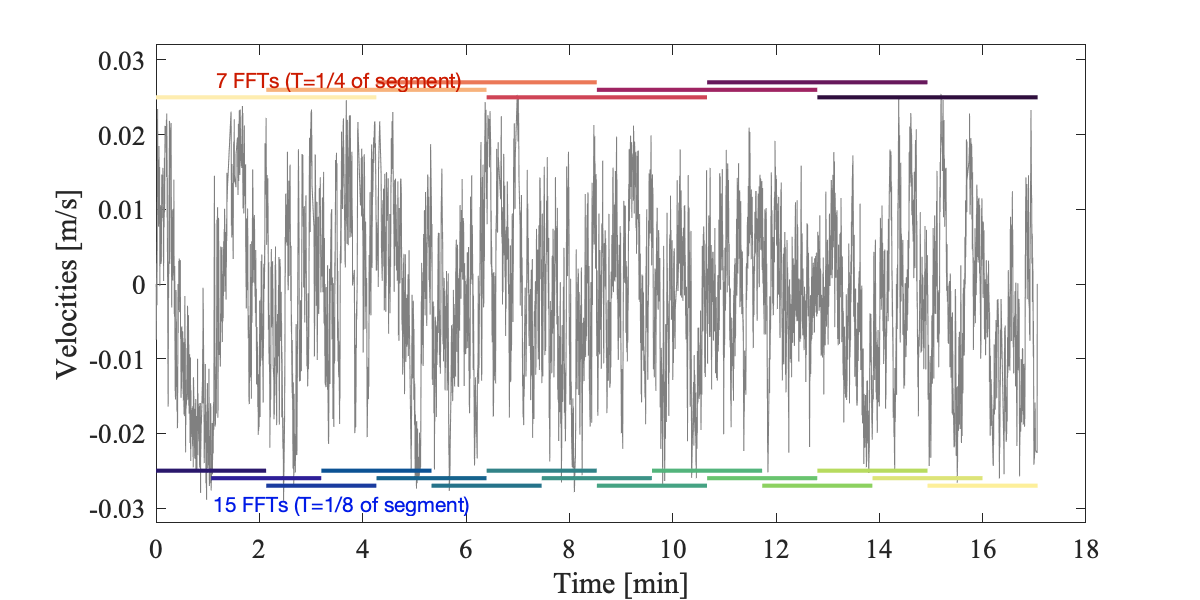
55 KB | CynthiaBluteau (talk | contribs) | Vertical velocity records (8192 samples at 8Hz) to illustrate the use of smaller subsets of to compute FFTs. 50% overlap and hanning window applied to each fft-segment of data. The 15 FFTs example (cold color tones) uses 1024 samples (128 s) of records... | 1 |
| 18:40, 1 December 2021 | Velocity timescales.png (file) |  |
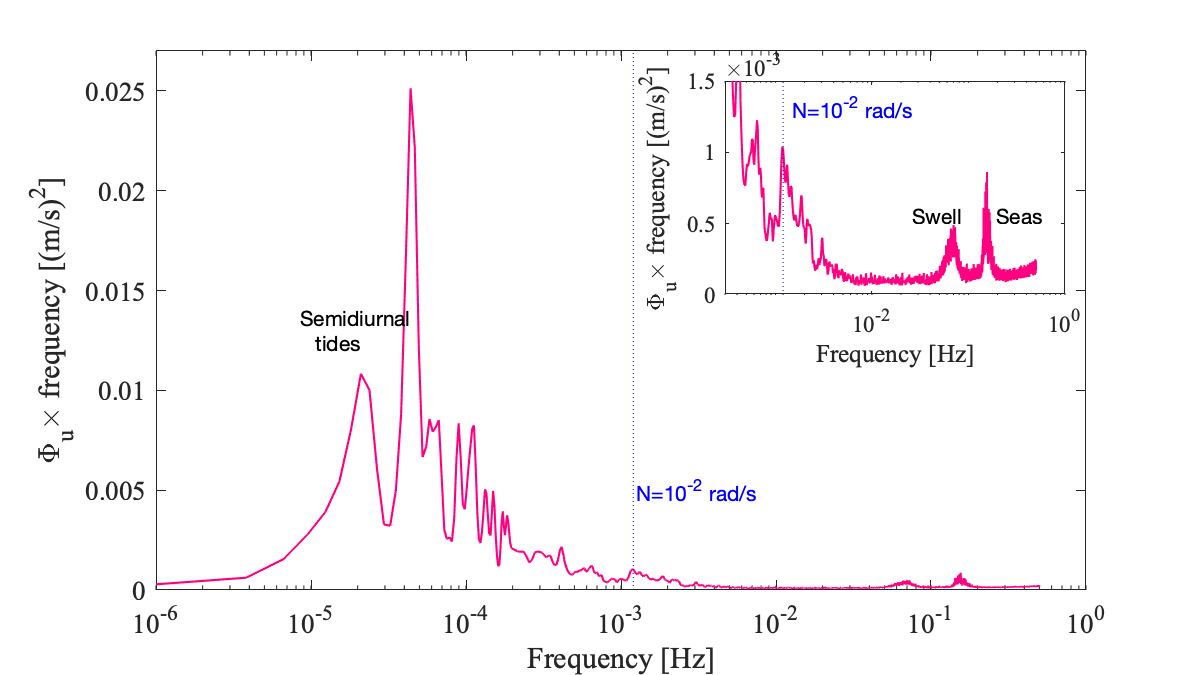
66 KB | CynthiaBluteau (talk | contribs) | Example velocity observations from an instrument impacted by tides and surface waves, which are presented as variance preserving spectra. The goal is to highlight when turbulence subranges begin in the grand scheme of physical processes that impact vel... | 1 |
| 20:59, 29 November 2021 | Short spectra.png (file) |  |
49 KB | CynthiaBluteau (talk | contribs) | Spectra of the short_timeseries.png to highlight the impact of detrending the entire timeseries first before segmenting onto 8.53 min (2048 samples) | 1 |
| 20:56, 29 November 2021 | Short detrend timeseries.png (file) |  |
84 KB | CynthiaBluteau (talk | contribs) | The detrended version of File:short_timeseries.png | 1 |
| 20:55, 29 November 2021 | Short timeseries.png (file) |  |
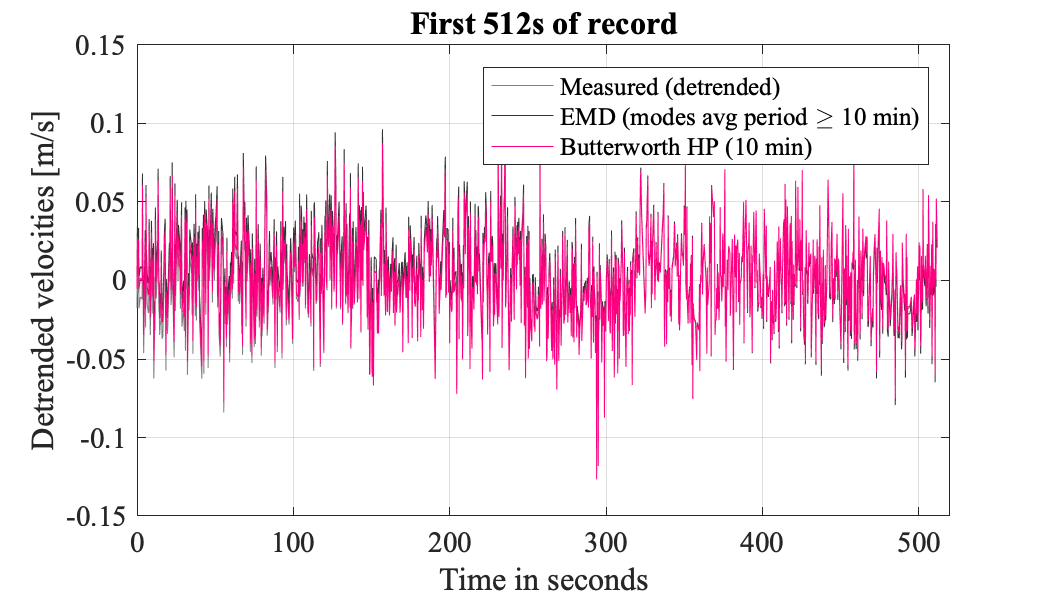
68 KB | CynthiaBluteau (talk | contribs) | Same as long_timeseries but showing only the first 512 s of data at 4Hz. | 1 |
| 17:22, 29 November 2021 | Long timeseries.png (file) |  |
89 KB | CynthiaBluteau (talk | contribs) | Example of velocities subsampled at 4Hz. Original timeseries measured at 64Hz, but lower sampling rate would be sufficient for IDM analysis. The different lines represent the results of various detrending. | 1 |
| 00:31, 25 November 2021 | Threshold logic Brock1986.png (file) |  |
37 KB | CynthiaBluteau (talk | contribs) | Fixed the threshold so that the local minimum is used for identifying thresholds, as opposed to the local minimum that reaches zero (ideal!) | 2 |
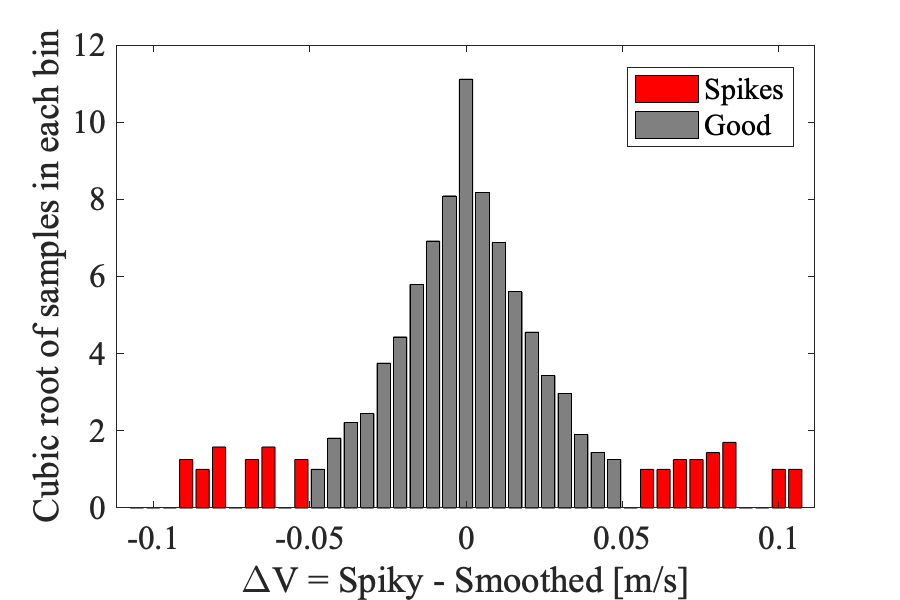
| 21:17, 24 November 2021 | Smoothed velocities.png (file) |  |
109 KB | CynthiaBluteau (talk | contribs) | Fixed legends, and identified the spikes on the bottom panel. | 3 |
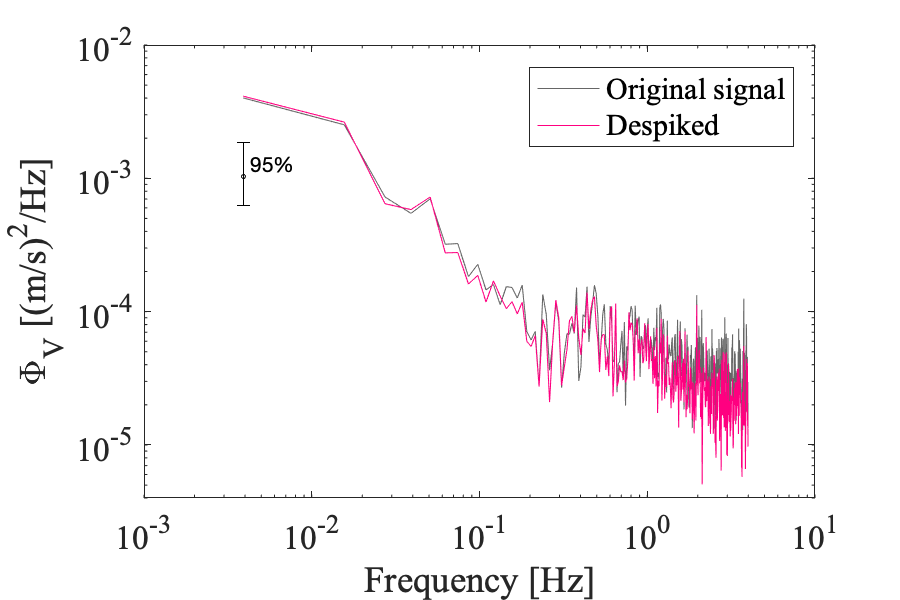
| 19:03, 24 November 2021 | Despike spectra.png (file) |  |
48 KB | CynthiaBluteau (talk | contribs) | Example velocity spectra before and after removing a modest number of spikes (30x over 4096 samples) | 1 |
| 18:34, 24 November 2021 | Velocities spike.png (file) |  |
52 KB | CynthiaBluteau (talk | contribs) | Increased font size and reduced size. | 2 |
| 18:48, 22 November 2021 | SF atomix ADCP.png (file) |  |
90 KB | CynthiaBluteau (talk | contribs) | 2 | |
| 11:17, 13 November 2021 | Forward diff.png (file) | 175 KB | Brian scannell (talk | contribs) | 4 | ||
| 17:13, 12 November 2021 | Velocity data.png (file) |  |
154 KB | Brian scannell (talk | contribs) | 4 | |
| 16:49, 12 November 2021 | InertialSubrangeSchematic.png (file) |  |
60 KB | Jmmcmillan (talk | contribs) | Schematic of the velocity spectra in the inertial subrange | 1 |
| 16:16, 12 November 2021 | InertialSubrange.png (file) |  |
60 KB | Jmmcmillan (talk | contribs) | Removed 'equilibrium range' and updated axes labels to match equations. | 2 |
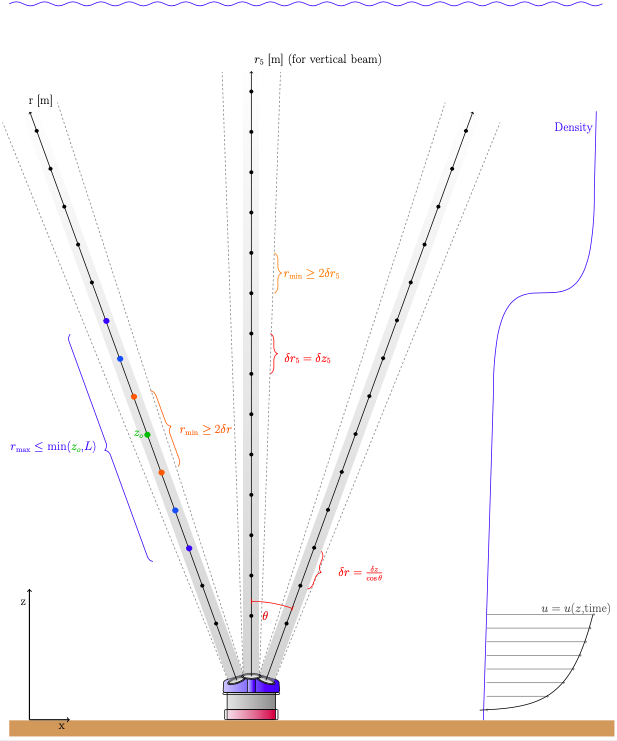
| 02:03, 11 November 2021 | ADCPschematic SF.png (file) |  |
77 KB | Jmmcmillan (talk | contribs) | Definition of structure function variables for a diverging beam. | 1 |
| 16:27, 10 November 2021 | Arnaud Pic.jpg (file) |  |
647 KB | Aleboyer (talk | contribs) | 1 | |
| 00:30, 9 November 2021 | Stationarity Figs.png (file) |  |
334 KB | CraigStevens (talk | contribs) | 1 | |
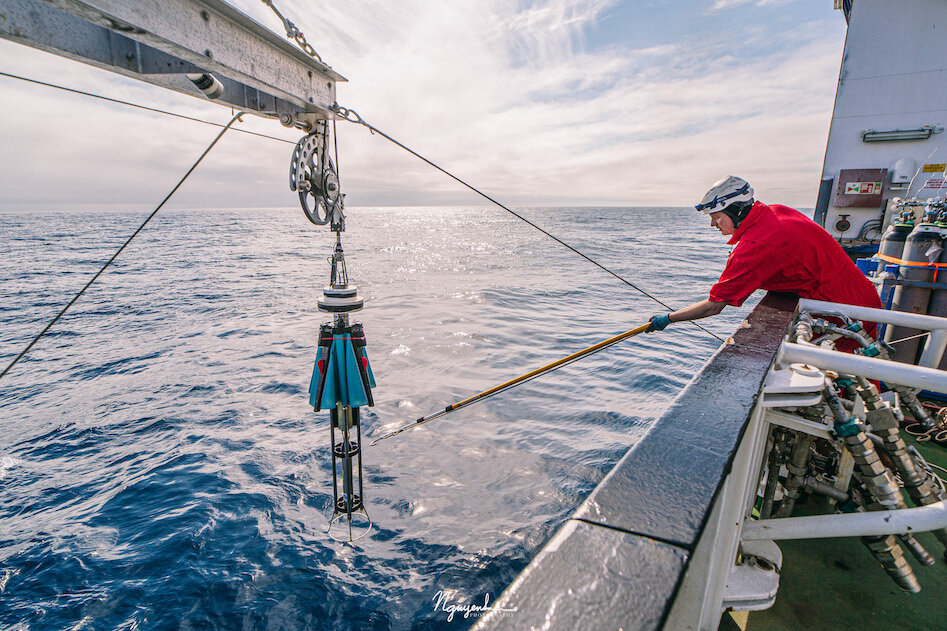
| 04:10, 23 October 2021 | Epsilometer EpsiFish FastCTDWinch.jpg (file) |  |
238 KB | Aleboyer (talk | contribs) | 1 | |
| 04:08, 20 October 2021 | UpwardsVMP250(DoubtfulSound-CLS).JPG (file) | .JPG) |
6.25 MB | CraigStevens (talk | contribs) | Upwards profiling VMP250 & Rebecca McPherson in DoubtfulSound (CLS, 5 September 2015) | 1 |
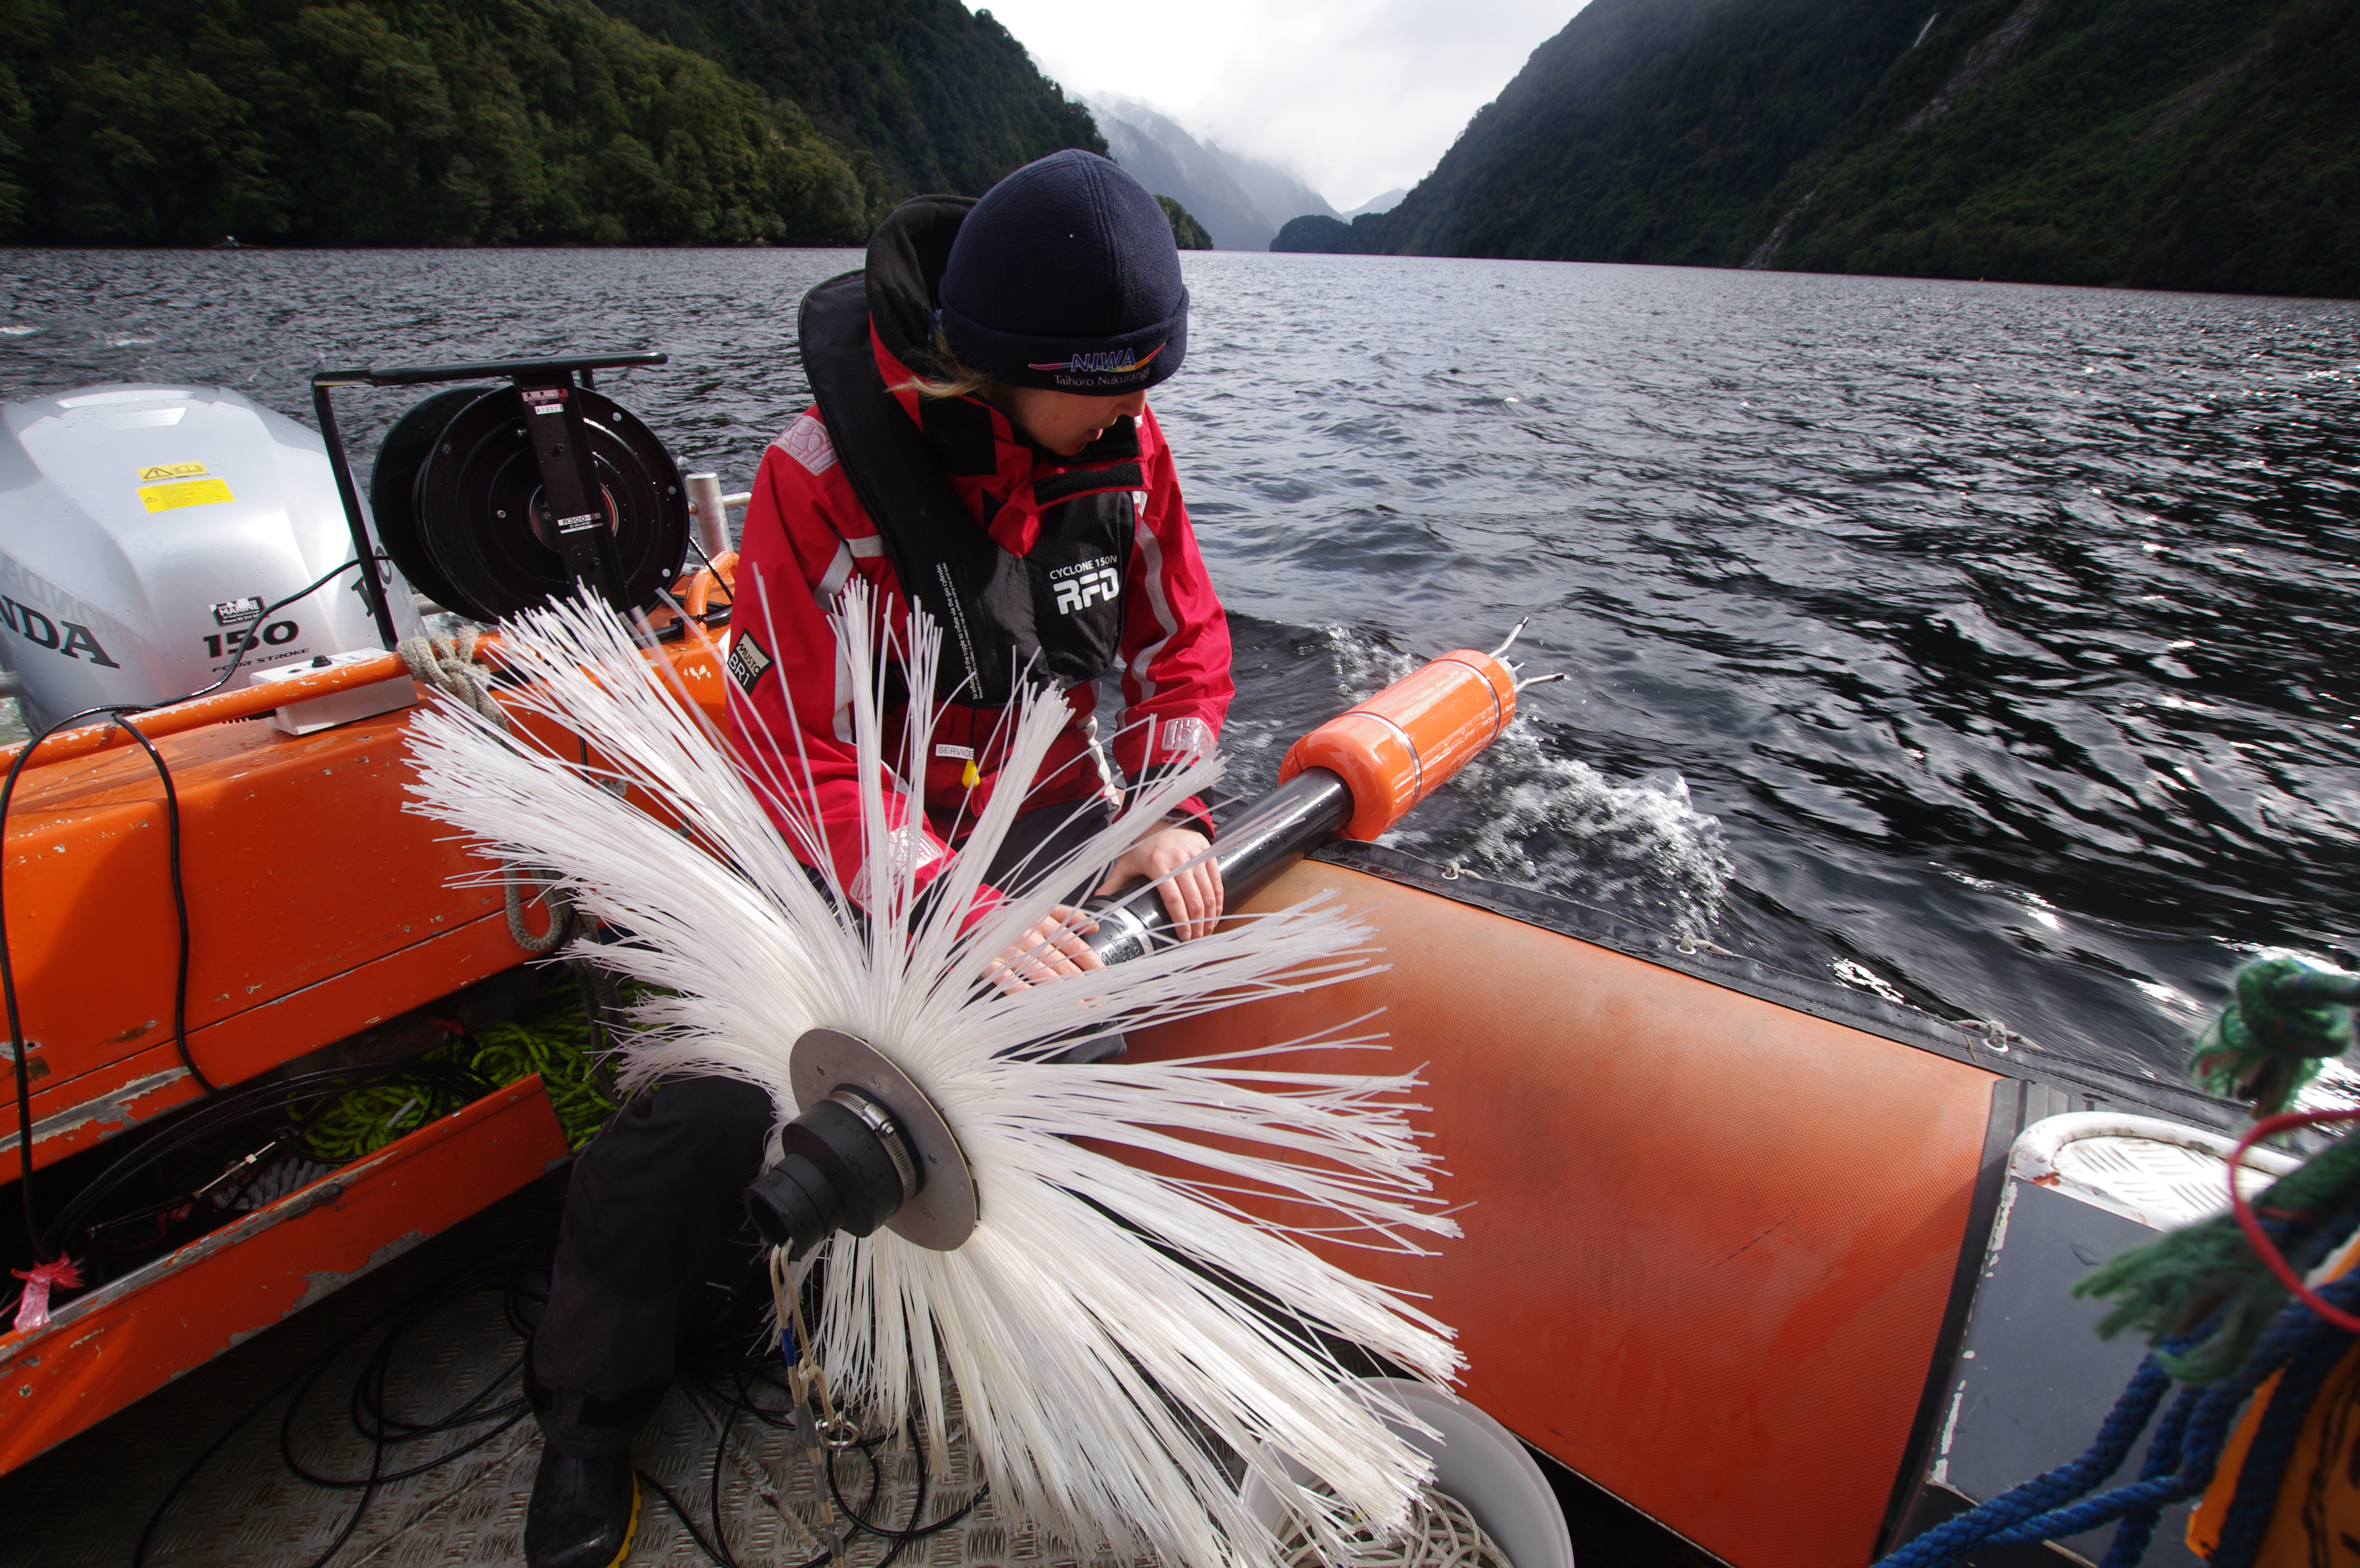
| 03:58, 20 October 2021 | NortekRope(CLS).JPG (file) | .JPG) |
1.29 MB | CraigStevens (talk | contribs) | Nortek Vector mounted on a line. (Stevens, 31 October 2011). | 1 |
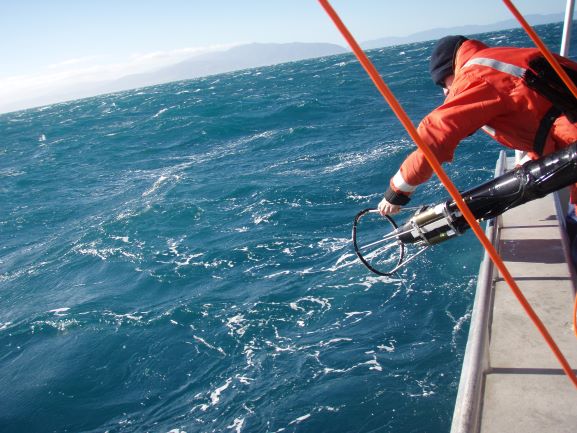
| 03:45, 20 October 2021 | VMP500-CookSt.JPG (file) |  |
61 KB | CraigStevens (talk | contribs) | VMP 500 being deployed in Cook Strait in rough weather. (Stevens) | 1 |
| 03:42, 20 October 2021 | VMP 2000.jpg (file) |  |
177 KB | CraigStevens (talk | contribs) | Rockland VMP 2000(?) - Rudi Jozef Maria Caeyers. | 1 |
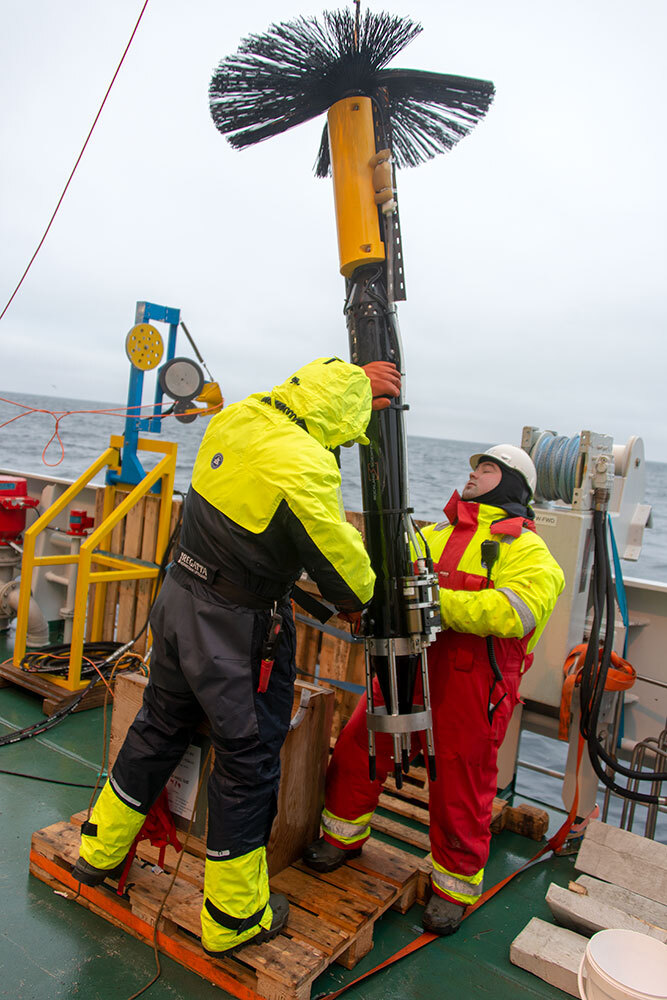
| 03:39, 20 October 2021 | RSI 5 float.jpg (file) |  |
299 KB | CraigStevens (talk | contribs) | Rockland MicroRider on profiling float. c/- RSI. | 1 |
| 03:36, 20 October 2021 | MSS ADCP CTD (Schaffer).JPG (file) | .JPG) |
7 MB | CraigStevens (talk | contribs) | MSS_ADCP_CTD_in_OceanCity_CC-BY Janin_Schaffer | 1 |
| 03:33, 20 October 2021 | AdcpMTOrig.png (file) |  |
114 KB | CraigStevens (talk | contribs) | Nortek signature ADCP in bottom-mounted frame. | 1 |
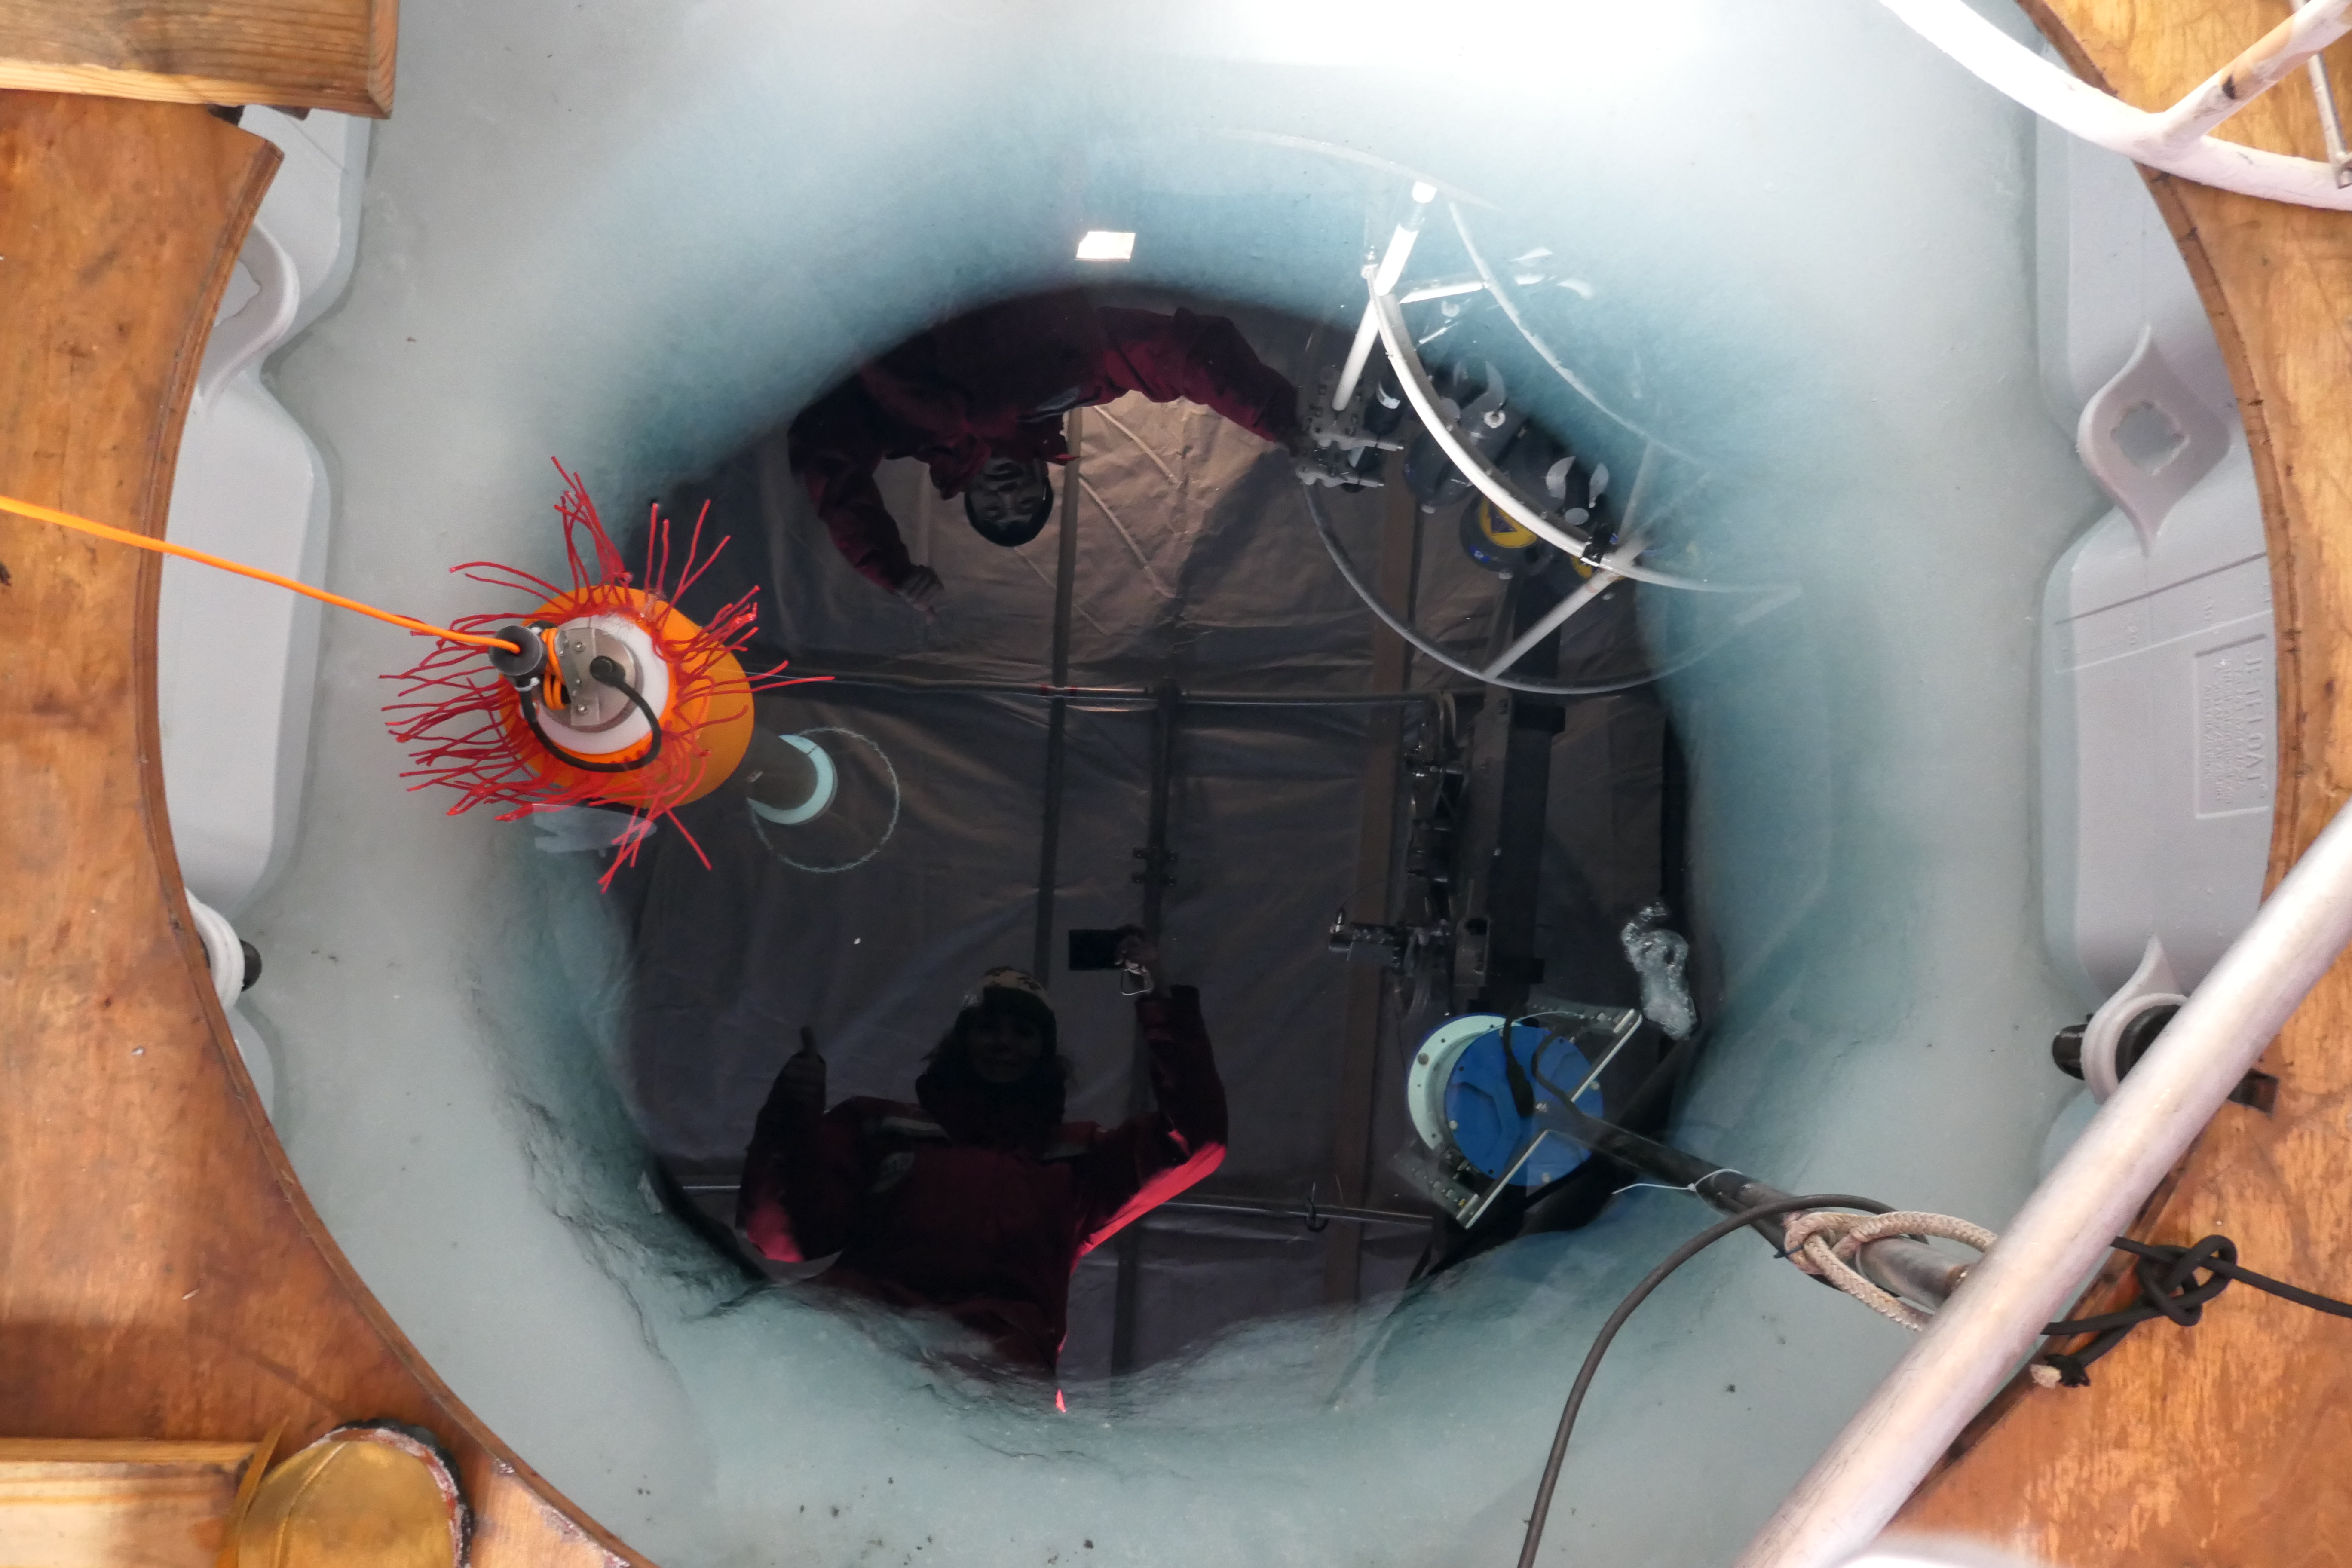
| 03:30, 20 October 2021 | MAVS ALG.jpg (file) |  |
580 KB | CraigStevens (talk | contribs) | Deployment of MAVS4 during N-ICE test cruise. N-ICE test cruise. 82ºN; Arctic; Arctic Ocean; Sea ice; c/- Algot Kristoffer Peterson. | 1 |
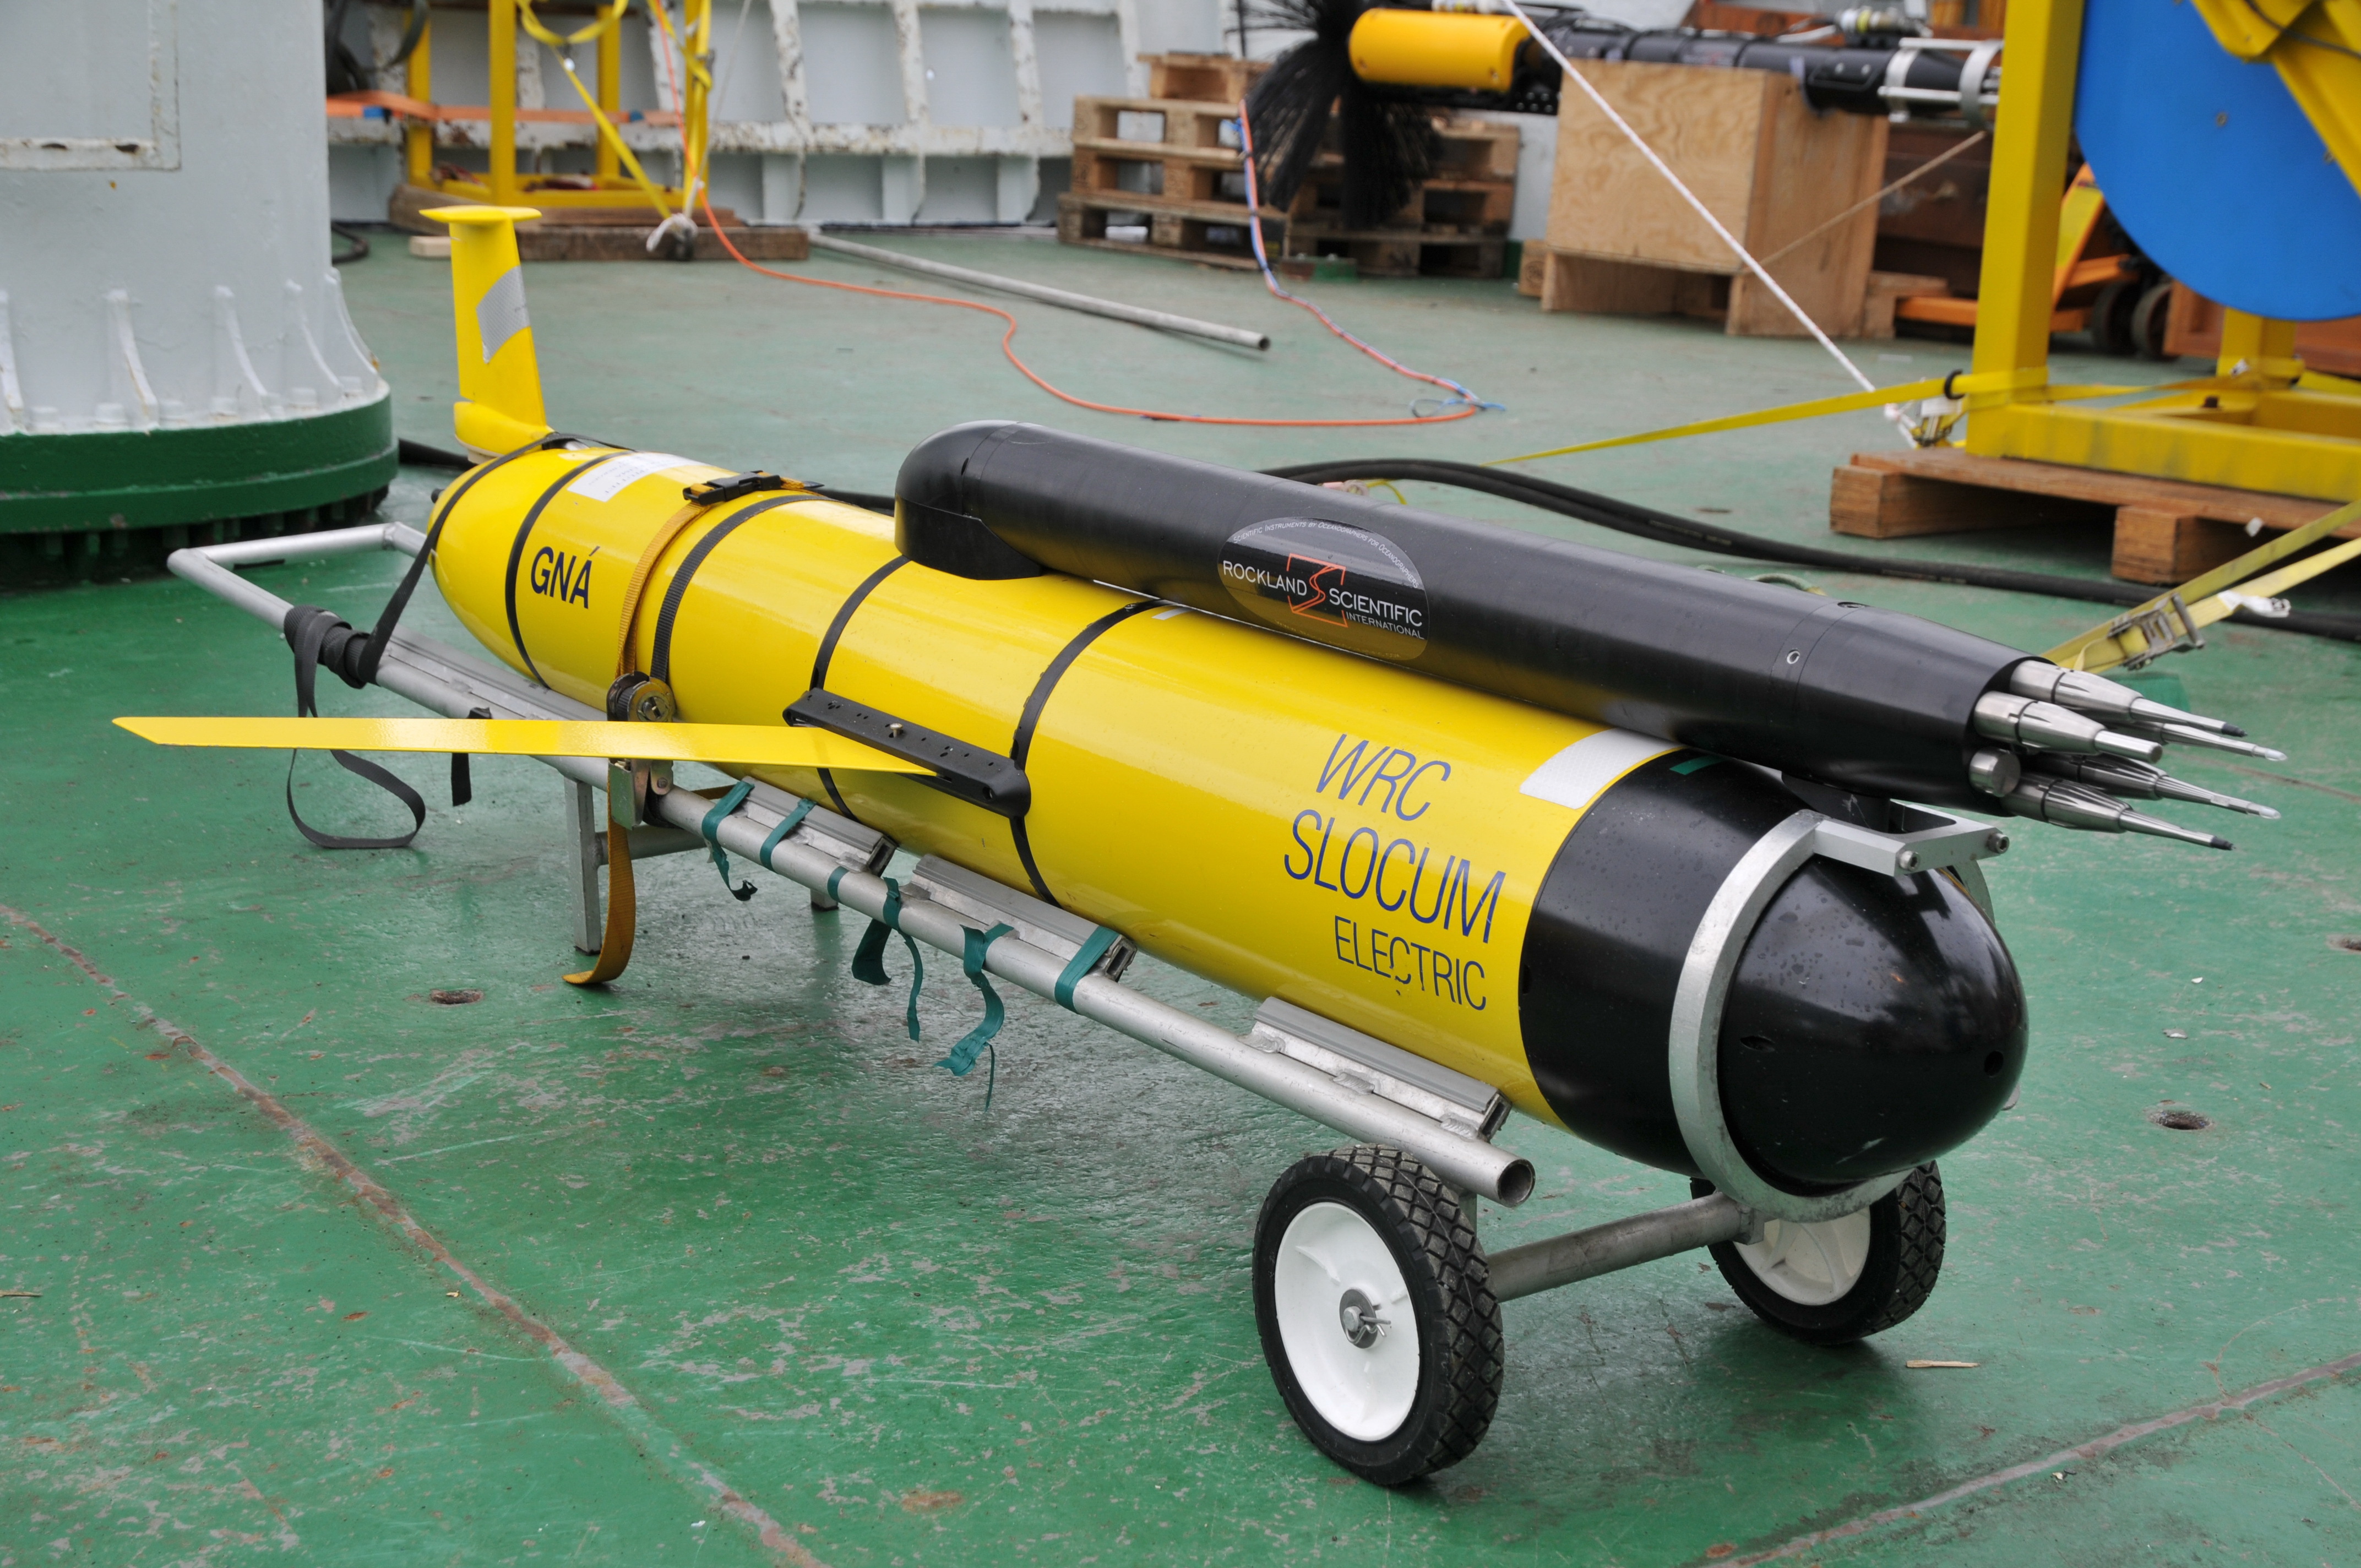
| 03:26, 20 October 2021 | M Rider Glider 1.JPG (file) |  |
2.5 MB | CraigStevens (talk | contribs) | Microrider on Slocum glider (Algot Kristoffer Peterson) | 1 |
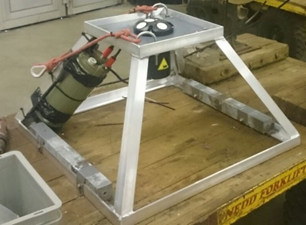
| 03:24, 20 October 2021 | TIC Leopold 1.jpg (file) |  |
1.16 MB | CraigStevens (talk | contribs) | Turbulence instrumentation cluster (Peter Leopold, 2012) | 1 |
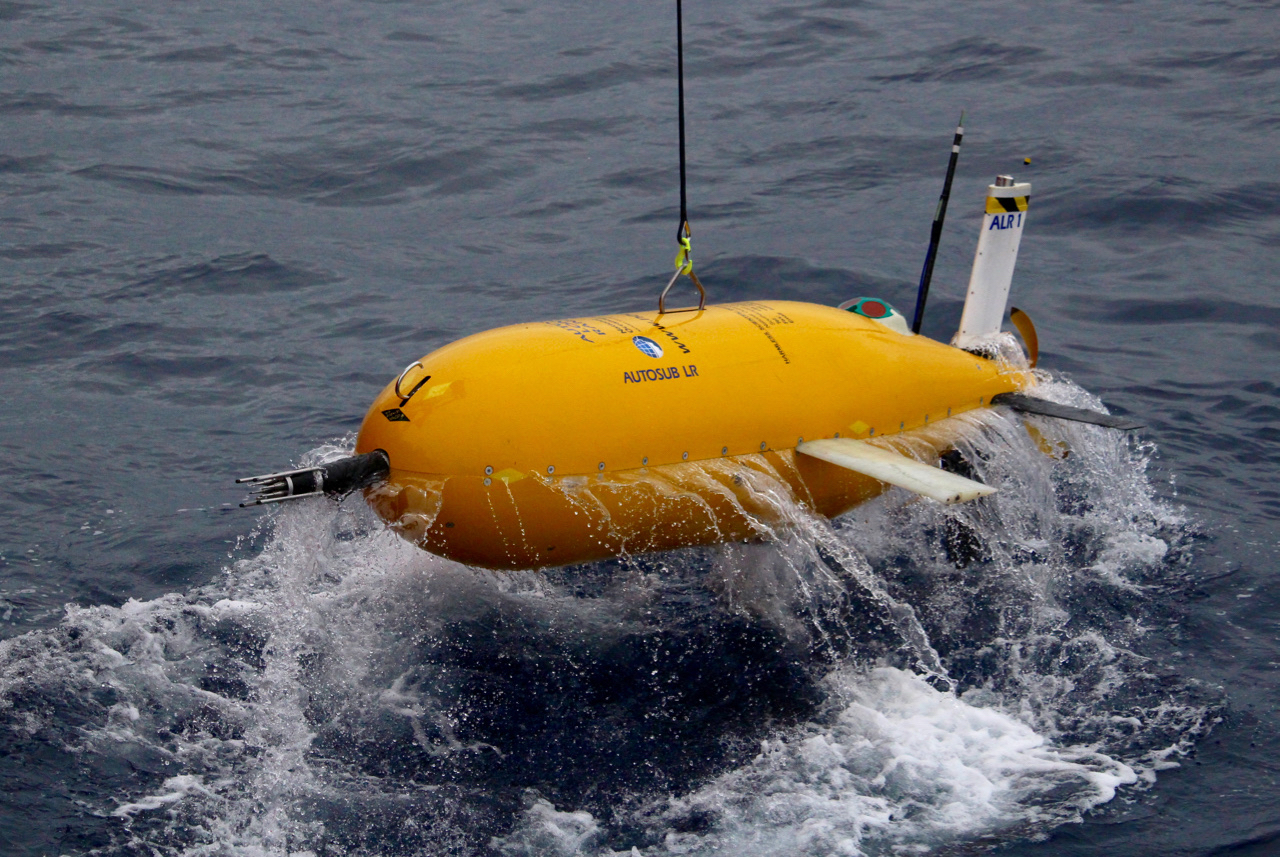
| 03:20, 20 October 2021 | RSI 1.jpg (file) |  |
1.08 MB | CraigStevens (talk | contribs) | Autosub with microrider (Rockland Scientific) | 1 |
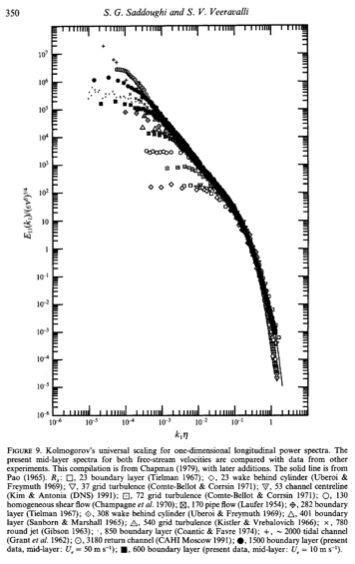
| 23:22, 13 October 2021 | Fig9 SV94.png (file) |  |
95 KB | CynthiaBluteau (talk | contribs) | Placeholder figure for the turbulence spectrum taken from Saddoughi, S., & Veeravalli, S. (1994). Local isotropy in turbulent boundary layers at high Reynolds number. Journal of Fluid Mechanics, 268, 333-372. doi:10.1017/S0022112094001370 | 1 |
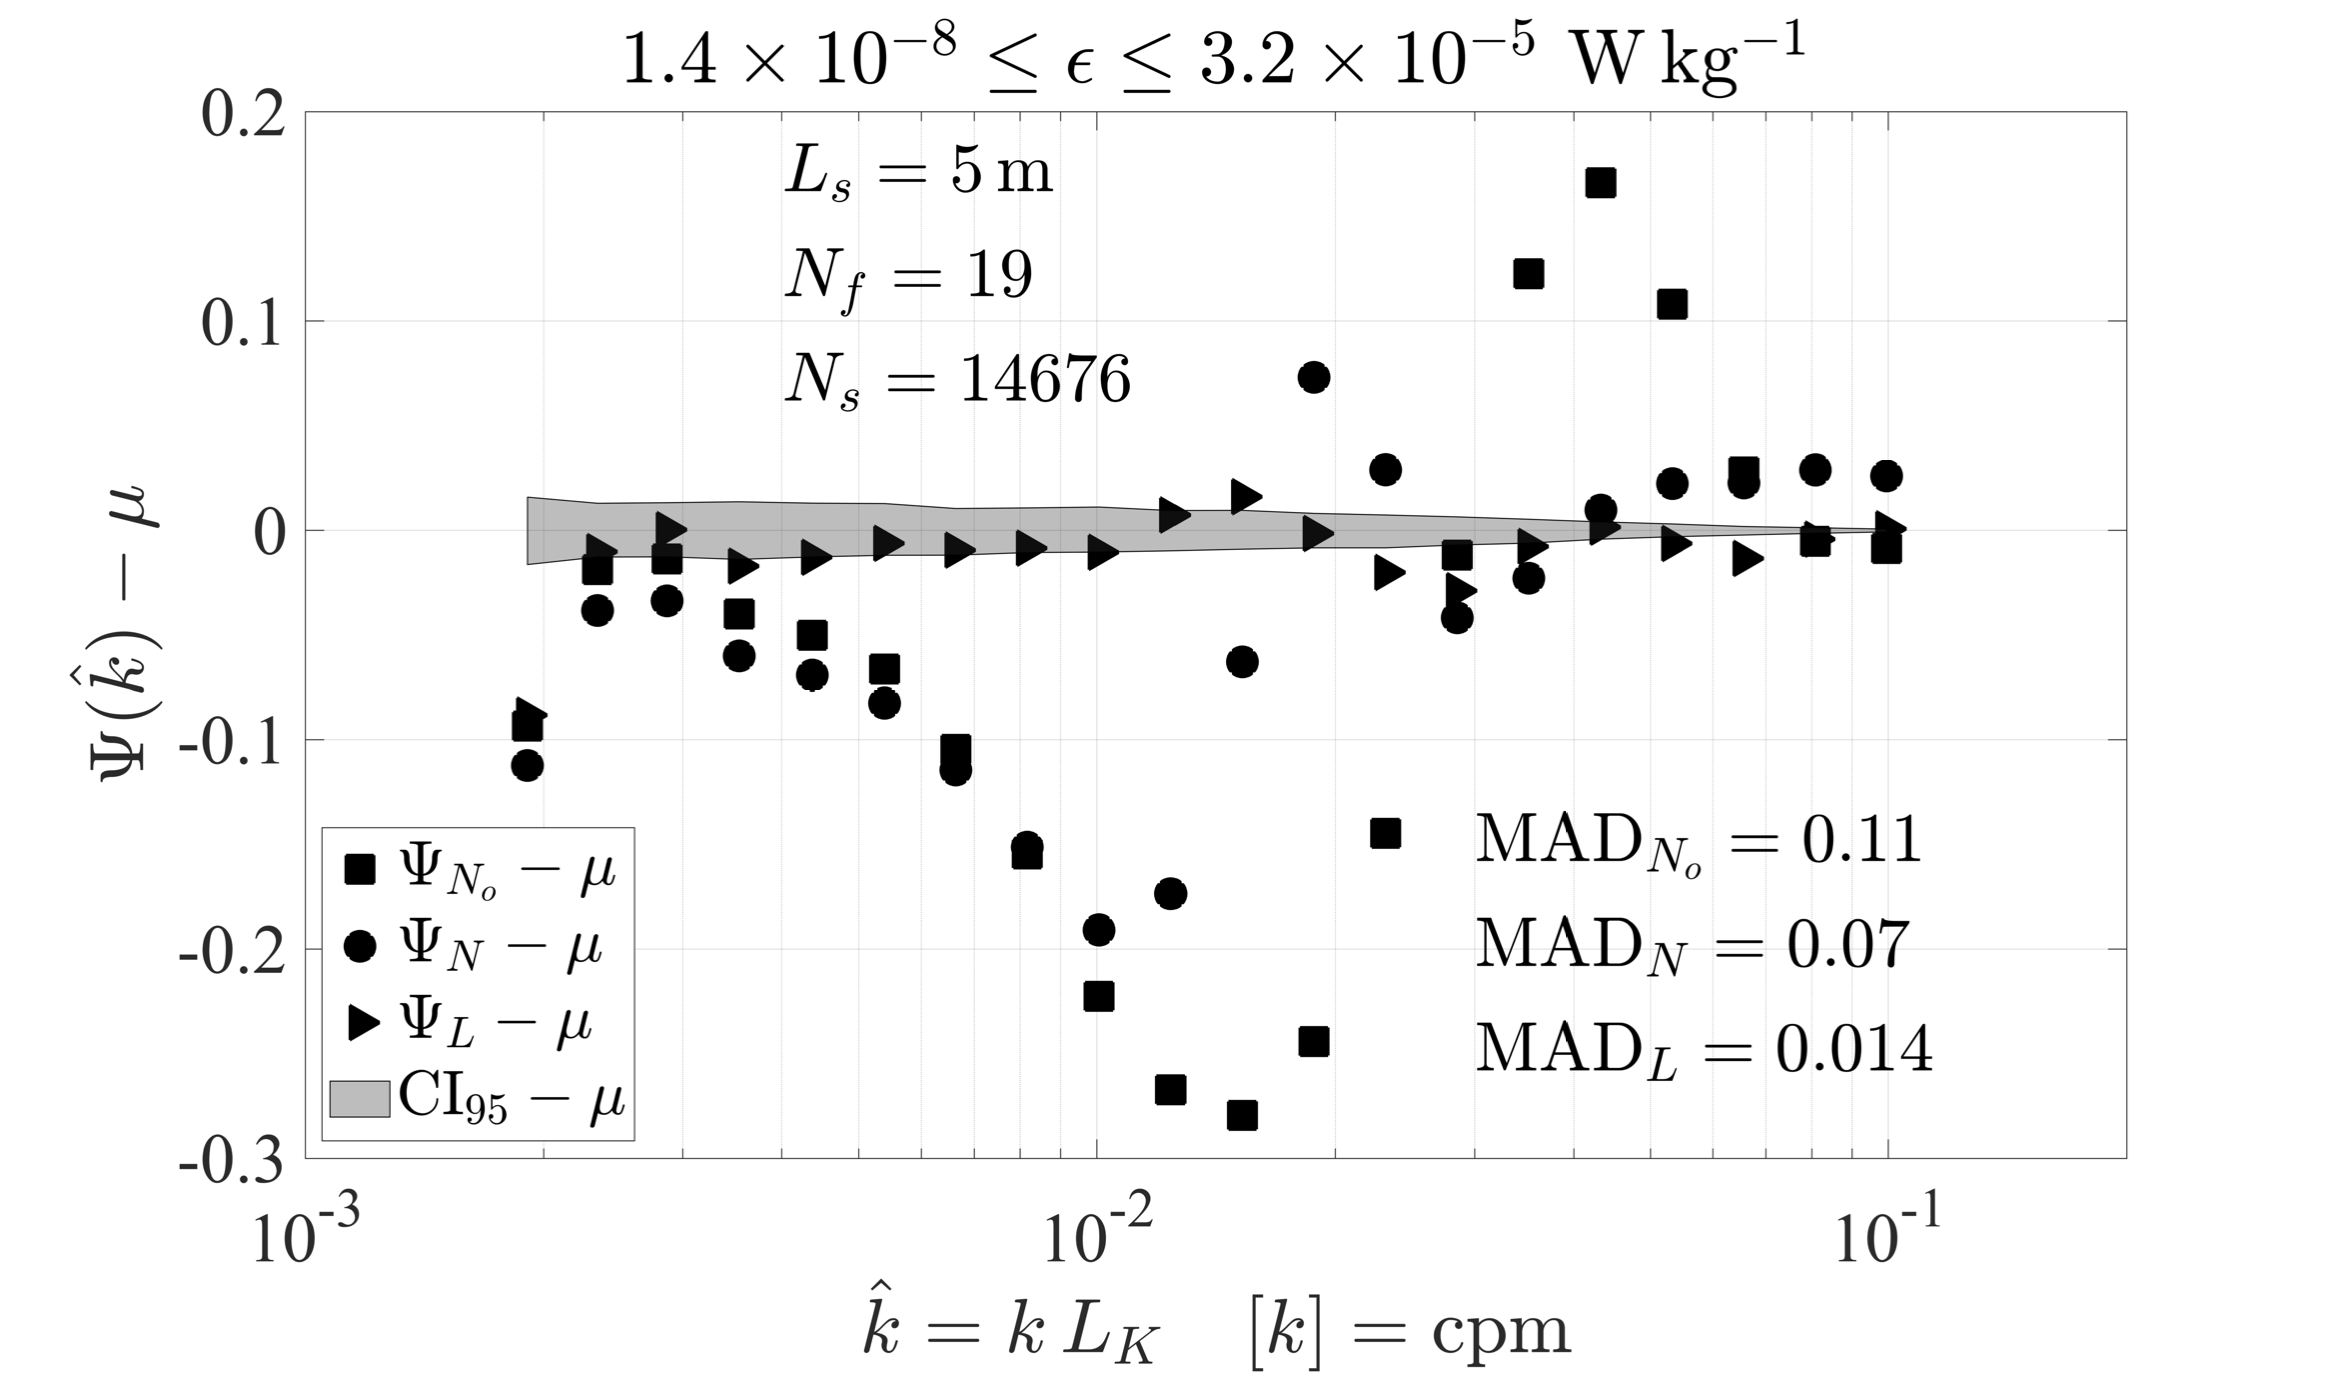
| 22:40, 19 May 2021 | Figure 7604 2.png (file) |  |
406 KB | Rolf (talk | contribs) | Deviation from spectral bin averages | 1 |
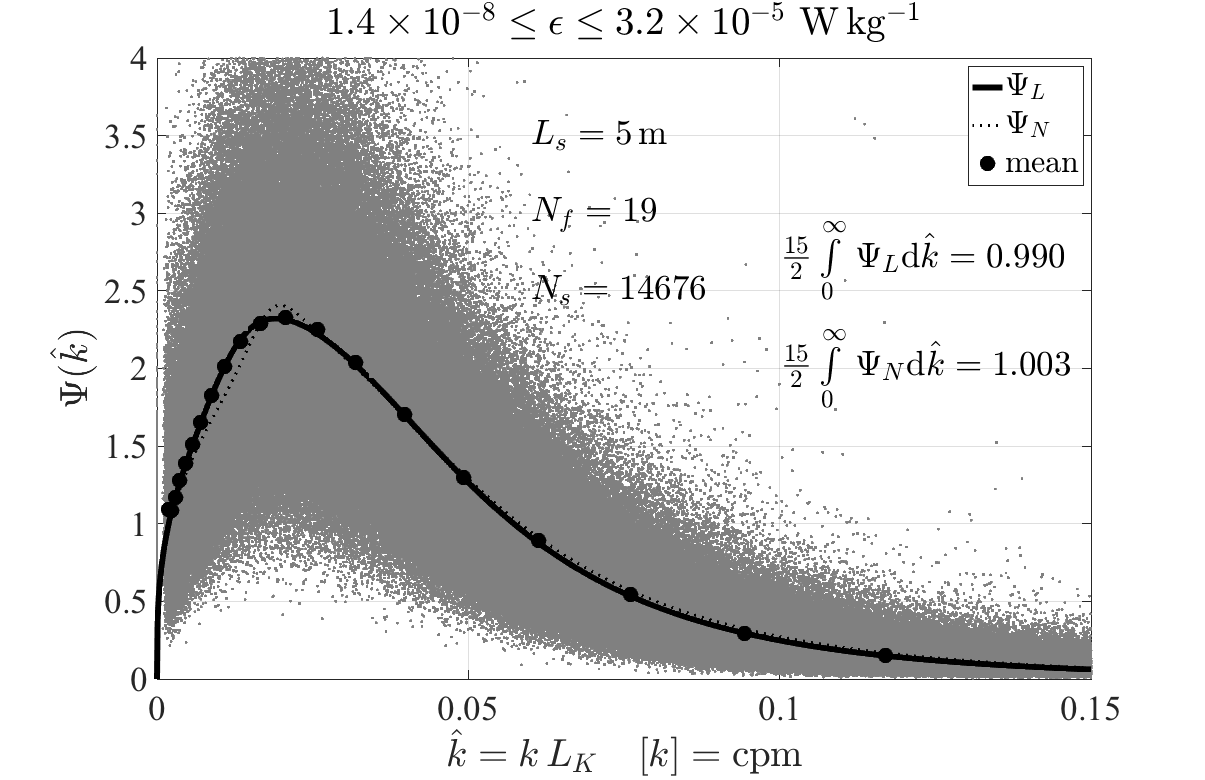
| 22:26, 19 May 2021 | Figure 7604.png (file) |  |
406 KB | Rolf (talk | contribs) | 2 | |
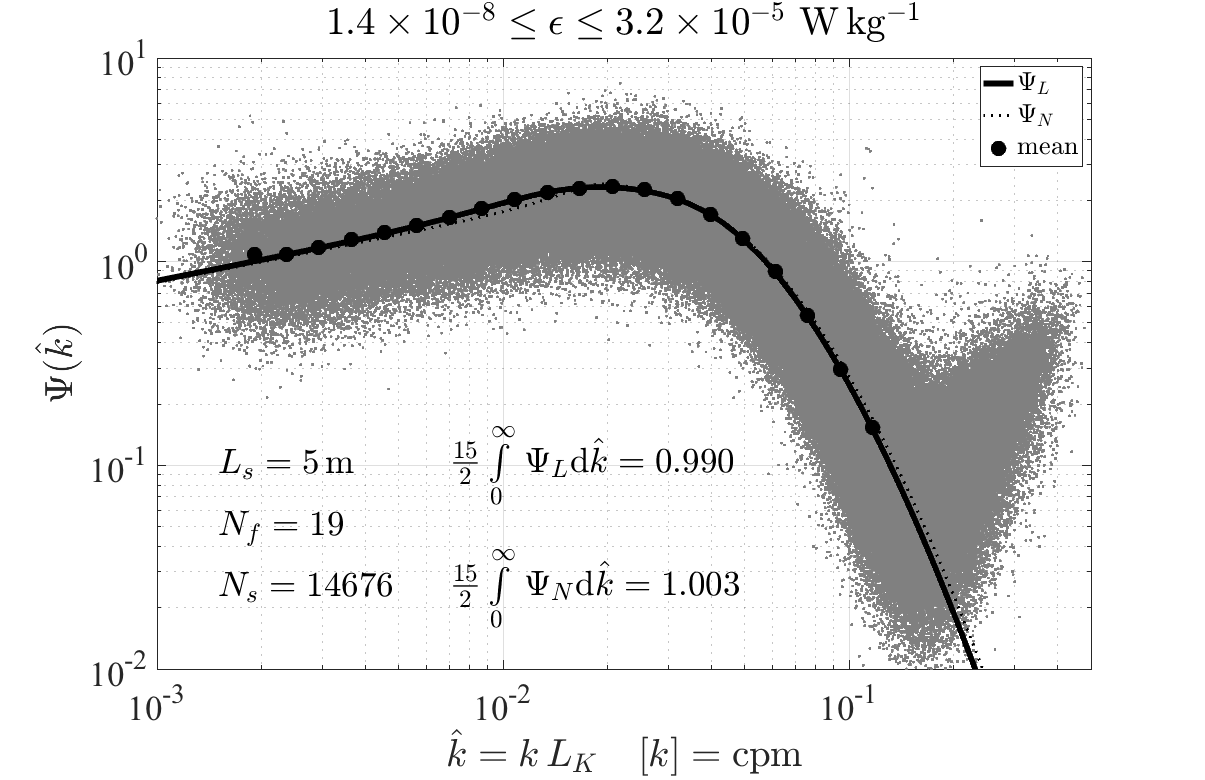
| 22:18, 19 May 2021 | Figure 7603.png (file) |  |
65 KB | Rolf (talk | contribs) | 2 | |
| 22:13, 19 May 2021 | Figure 7602.png (file) |  |
62 KB | Rolf (talk | contribs) | 2 | |
| 19:20, 19 May 2021 | Figure 7603 2.jpg (file) |  |
1.13 MB | Rolf (talk | contribs) | 1 | |
| 19:16, 19 May 2021 | Figure 7602 2.jpg (file) |  |
808 KB | Rolf (talk | contribs) | 1 | |
| 18:16, 19 May 2021 | Figure 01.png (file) |  |
354 KB | Rolf (talk | contribs) | 1 | |
| 18:13, 19 May 2021 | Figure 380.png (file) |  |
468 KB | Rolf (talk | contribs) | 1 | |
| 18:09, 19 May 2021 | Figure 379 2.png (file) |  |
780 KB | Rolf (talk | contribs) | 1 | |
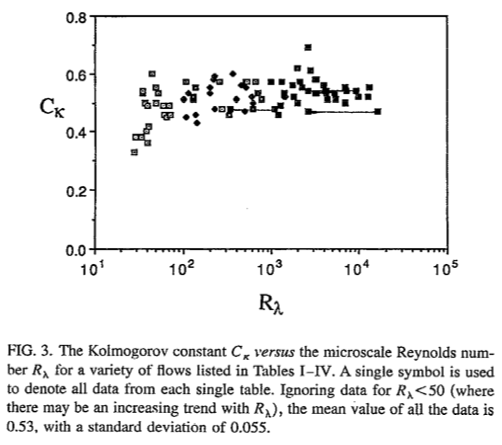
| 17:57, 19 May 2021 | Sreenivasan2.png (file) |  |
66 KB | Rolf (talk | contribs) | 1 | |
| 17:19, 19 May 2021 | Figure 379.pdf (file) | 1.24 MB | Rolf (talk | contribs) | 1 | ||
| 17:15, 19 May 2021 | Sreenivasan.pdf (file) | 269 KB | Rolf (talk | contribs) | 1 | ||
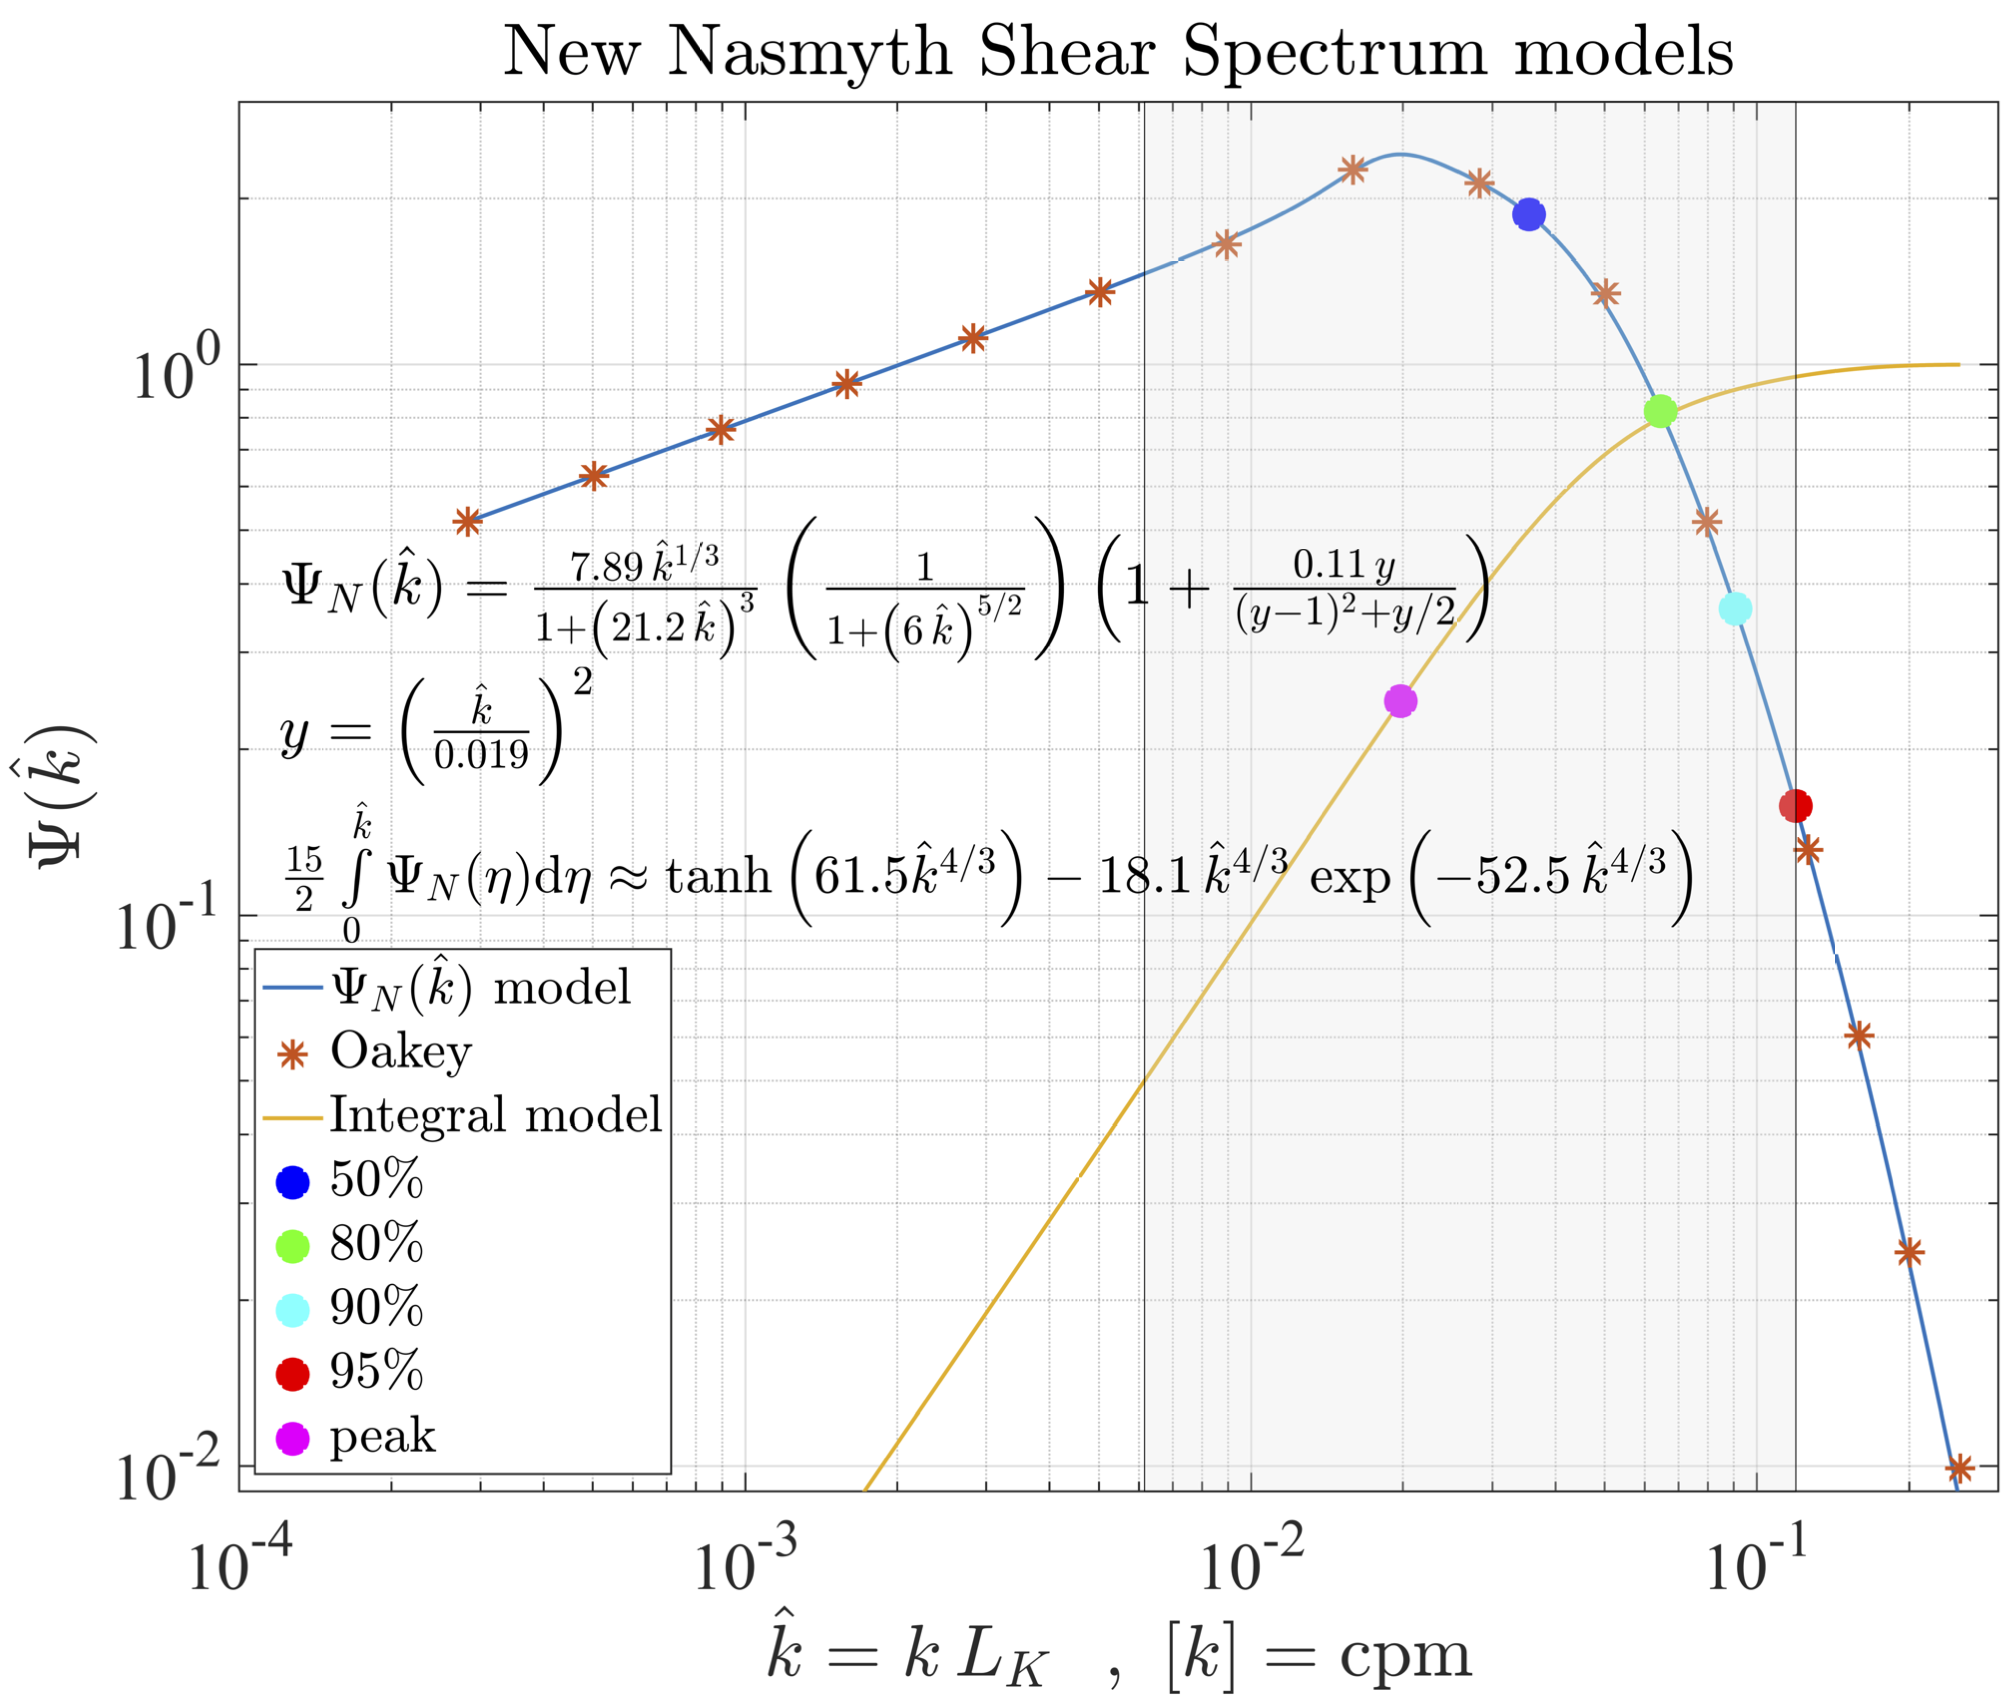
| 07:56, 19 May 2021 | Shear spectra 3.png (file) |  |
29 KB | Ilker (talk | contribs) | Example shear spectra | 1 |
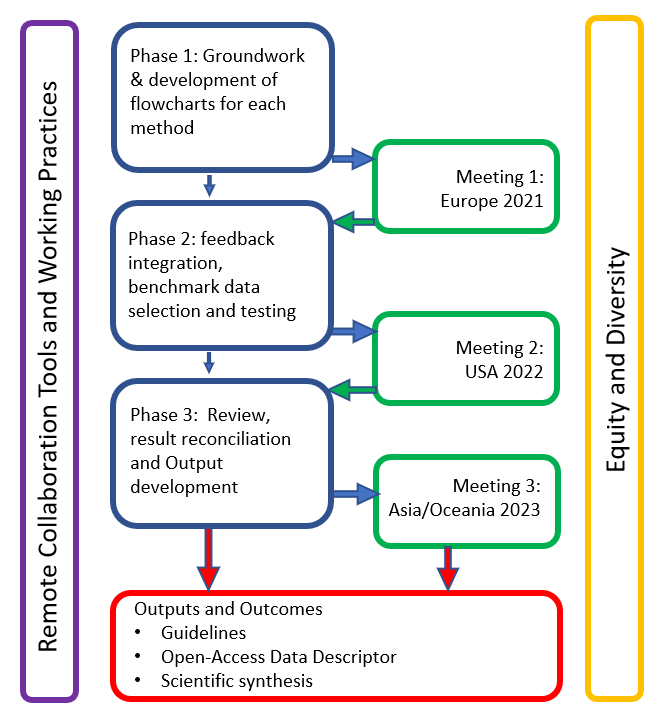
| 07:53, 19 May 2021 | SCOR-workplanV2.png (file) |  |
60 KB | Ilker (talk | contribs) | 1 | |
| 14:02, 24 March 2021 | Proposal.pdf (file) | 1.09 MB | CynthiaBluteau (talk | contribs) | Proposal file but w/o underscores in the filenames | 1 | |
| 13:18, 24 March 2021 | SCOR WG ATOMIX.pdf (file) | 1.09 MB | CynthiaBluteau (talk | contribs) | Submitted and approved proposal by SCOR. | 1 |

